Battery life showdown: See how popular flagships stack up against each other
| Battery specifications (official) | |||||
| Battery capacity | Talk time | Standby time | Video playback | Music playback | |
| Samsung Galaxy S6 | 2,550 mAh | 17 hours (3G) | - | 13 hours | 49 hours |
| Samsung Galaxy Note 4 | 3,220 mAh | 20 hours (3G) | - | 14 hours | 82 hours |
| Apple iPhone 6 | 1,810 mAh | 14 hours (3G) | 10.4 days (2G) | 11 hours | 50 hours |
| Apple iPhone 6 Plus | 2,915 mAh | 24 hours (3G) | 16 days (2G) | 14 hours | 80 hours |
| LG G3 | 3,000 mAh | 21 hours (3G) | 22.8 days (2G) | - | - |
| LG G4 | 3,000 mAh | 19 hours (3G) | 15 days (2G) | - | - |
| HTC One M9 | 2,840 mAh | 21.7 hours (3G) | 16.3 days (3G) | ||
| Sony Xperia Z3 | 3,100 mAh | 14 hours (2G) | 37.1 days (2G) | 10 hours | 130 hours |
| Google Nexus 6 | 3,220 mAh | 24 hours (2G) | 13.8 days (2G) | 10 hours | - |
| Samsung Galaxy Note Edge | 3,000 mAh | 18 hours (3G) | - | 12 hours | 67 hours |
But battery benchmarks are incredibly hard to get right — there are just so many variables involved. From differences in software, through the impossibility to encompass all usage scenarios, down to the core of the testing methodology itself. Not at all coincidentally, various smartphone benchmarking suites offer to test for battery life, and in many cases offer conflicting results. That isn't because one is necessarily inferior than the other, but because they focus on different areas. Today, we'll be taking a closer look at what such third-party benchmarks produce in terms of results, what the thinking behind them is, and if any one flagship can be crowned as an objective king of the hill.
Geekbench 3
The work of Primate Labs Inc., Geekbench is a widely-respected, CPU-centric benchmark which, as of its latest major update, can now also benchmark battery life cross-platform — so both Android and iOS devices.
At its core, Geekbench 3 runs a subset of tests in a loop, trying to perform a given number of iterations per second. If the device manages to get these done, it spends the remaining time sitting idle. If not, the target iterations are reduced. The resulting score is then the multiplication of the total runtime of the test (so from 100% battery to 0%) times the average number of iterations per second. By rewarding phones that complete more iterations per second and spend less time idle, the benchmark essentially polices itself and doesn't allow poorly-performing devices to climb to the top through runtime alone, as that would have been the result of more time spent idle and not burning through its battery. That's why the runtime of the test is less important than the actual, final battery score, as you'll see below (the Note and the LG G3 are good examples of this).
Before we get to the scores themselves, it's important to point out that Geekbench 3 automatically dims the screens of all devices to a preset level, and all the testing happens behind the scene. That is, the test is synthetic in nature, and not an attempt to mimic real world scenarios such as browsing a page, opening and closing apps, editing photos, and so on.
As you can see, Samsung's Galaxy S6, despite its smallish, 2,550 mAh battery, actually aced Geekbench 3's tests, and ranked at the top with a sizable advantage over Sony's Xperia Z3. The LG G4, too, had a good showing, and suggests that a lot has changed since the days of the LG G3, which ranked second to last. Looking at Apple's iDevices, the regular iPhone 6 finished last, while the larger 6 Plus took a middle spot. PCMark
Developed by Futuremark — the company behind other well-known products such as 3DMark — PCMark is a general purpose performance testing suite for Android. As you probably guessed, that suite of benchmarks also includes a dedicated battery test.
We quite liked what Futuremark has done with the battery test within PCMark, as real world workloads are looped to better predict actual run time. For example, tested areas include text processing, web browsing, photo editing, video playback, and more. All of these take place on screen and we can watch how the device is handling them. In short, it's a looped scenario made up of a number of mini scenarios that attempt to mimic typical, active usage of the device.
Active usage is key to PCMark's testing methodology, and for good reason. More specifically, the benchmark runs from 100% to 20%, and does not go any lower than that by design. Since many phone makers optimize their devices for critical battery levels, and in some cases make a big difference, we were wondering why that is, and so we asked Futuremark directly. We were told that since users almost always correct their usage when they're almost out of charge and avoid the type of activities that PCMark tests for (true), it makes sense for that part to not be included. It's not a perfect solution, of course, but it makes a lot of sense. So what PCMark does is instead extrapolate the score from 20% to 5% based on its performance thus far, and the final 5% are discarded altogether.
Here's the exact formula:
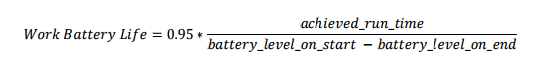
Lastly, it's important to note that PCMark advises users to calibrate their screen's brightness to 200 nits, just as we do on our own, in-house test. The scores you see below were all achieved with the test devices set at that brightness level.
PhoneArena.com's custom battery benchmark
As many of you likely know, we have our own custom battery benchmark, which was developed in-house. At its core, it's something of a mix between what both Geekbench 3 and PCMark have going on in that it blends synthetic components with real world scenarios. Like PCMark, we also carry out our test with the phones set at 200 nits brightness in order to get more consistent results.
So how does it work? Essentially, the test is an attempt to mimic real world battery life by breaking it down into a number of categories based on research on smartphone usage. So, for example, if our data indicates that the average Joe out there spends 20% of his hands-on time watching video, our script will attempt to simulate the activity with a synthetic workload, all the while the screen is kept on. Obviously, video playback is only one of several categories that we test for to estimate a smartphone's battery life.
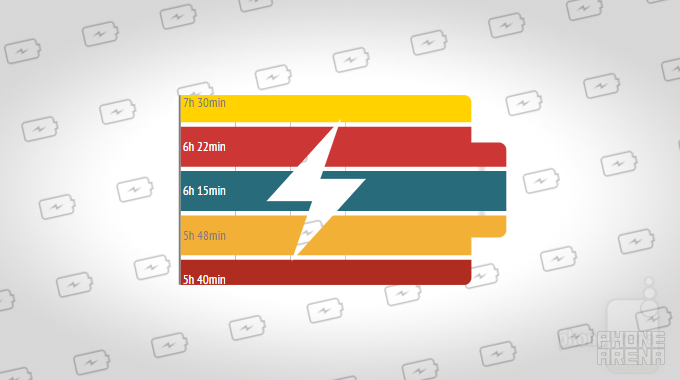
Unlike PCMark, however, our own benchmark runs from 100% until the battery is completely exhausted and the device turns off. This means that whenever the phone gets into critical territory, somebody is watching at all times in order to dismiss any low battery prompts that dim the screen and invalidate the test. Also, even though we don't always state this publicly, it's not uncommon for us to re-run tests if we suspect something might have gone wrong. Almost without exception, however, successive runs indicate statistically insignificant deviations that reinforce our initial findings. Here they are:
Best by unanimous decision?
Now that we've gotten the specifics out of the way, you might be wondering why every benchmark seems to differ with its rankings. That's understandable, but you should keep in mind that each of them tests for different things and is resting on a methodology that can differ considerably. It is therefore logical to see contradicting scoring.
For what it's worth, our opinion is that PCMark, along with our own battery benchmark, are adequate predictors of battery life since they're either entirely or partially based on workloads that the typical user's device will experience. Geekbench 3 attempts to do that, as well, though we don't quite agree with the screen dimming part — after all, most of us care about screen-on time at least as much as standby time.
With the above in mind, the best you, as a consumer, can do is to take all three into account and estimate their unanimous performance accordingly. We did just that, and the way we see it, the Sony Xperia Z3, the Galaxy S6, and the Note 4 — in that order — consistently perform the best. At the other end of the spectrum we've got the iPhone 6 (though we have one data point less for it), LG G3, and HTC One M9, the three of which performed worst.
Final standing

Popular stories

Latest News


Things that are NOT allowed:
To help keep our community safe and free from spam, we apply temporary limits to newly created accounts: