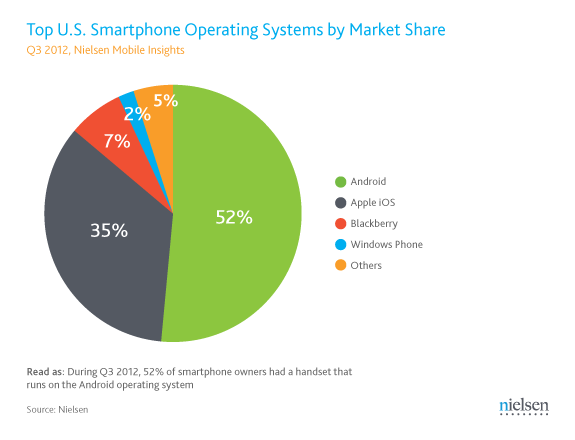
Nielsen: again more smartphones than feature phones in Q3, Android and iOS keep on mauling the competition
| Rank | Apps | Avg Unique Users | YTD Change % |
|---|---|---|---|
| 1 | Google Search | 44,386,000 | 54% |
| 2 | Gmail | 44,516,000 | 45% |
| 3 | 42,379,000 | 48% | |
| 4 | Google Maps | 41,976,000 | 41% |
| 5 | YouTube | 32,223,000 | 70% |
| 6 | Pandora Radio | 11,600,000 | 55% |
| 7 | 10,674,000 | 122% | |
| 8 | Adobe Reader | 10,354,000 | 64% |
| 9 | Advanced Task Killer | 9,569,000 | -11% |
| 10 | The Weather Channel | 8,983,000 | 59% |
| Source: Nielsen, Data from January – October 2012 (Android only). Ranked on average monthly unique users. Read as: During 2012 44 million Android smartphone owners used the Google Search app on average each month, growing their unique users 54% between January and October 2012. | |||
| Rank | Apps | Avg Unique Users | YTD Change % |
|---|---|---|---|
| 1 | Maps | 32,365,000 | 23% |
| 2 | 28,585,000 | 51% | |
| 3 | YouTube | 22,626,000 | -4% |
| 4 | Stocks | 21,080,000 | 51% |
| 5 | Weather | 20,531,000 | 41% |
| 6 | Facebook Messenger | 10,458,000 | 544% |
| 7 | The Weather Channel | 10,446,000 | 54% |
| 8 | 9,748,000 | 47% | |
| 9 | Pandora Radio | 9,563,000 | 47% |
| 10 | 6,910,000 | 197% | |
| Source: Nielsen, Data from January – October 2012 (iOS only). Ranked on average monthly unique users. Read as: During 2012 28 million iPhone owners used the Facebook app on average each month, growing their unique users 51% between January and October 2012. | |||
source: Nielsen
Follow us on Google News


![Some T-Mobile users might be paying more starting in March [UPDATED]](https://m-cdn.phonearena.com/images/article/176781-wide-two_350/Some-T-Mobile-users-might-be-paying-more-starting-in-March-UPDATED.webp)


Things that are NOT allowed:
To help keep our community safe and free from spam, we apply temporary limits to newly created accounts: