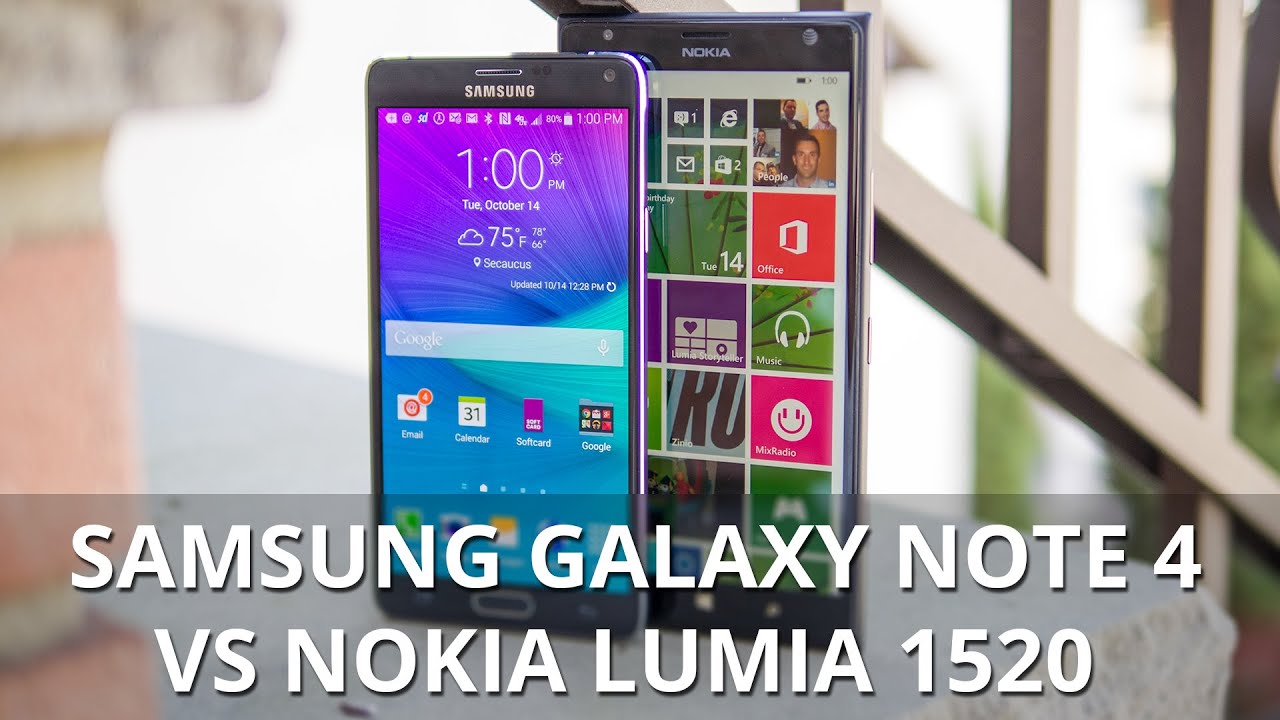
Samsung Galaxy Note 4 vs Nokia Lumia 1520

Introduction
Microsoft’s presence in the phablet space is still widely regarded as insignificant, especially when there are only two giant sized Windows Phones in circulation. One of them is none other than the Nokia Lumia 1520, which impressively continues to be relevant in the space – despite being a model that’s a year old. During that time, it has seen significant competition from the Android side, but it surely has a lot to be worried about now that the Samsung Galaxy Note 4 is embarking on its quest for domination.
Design
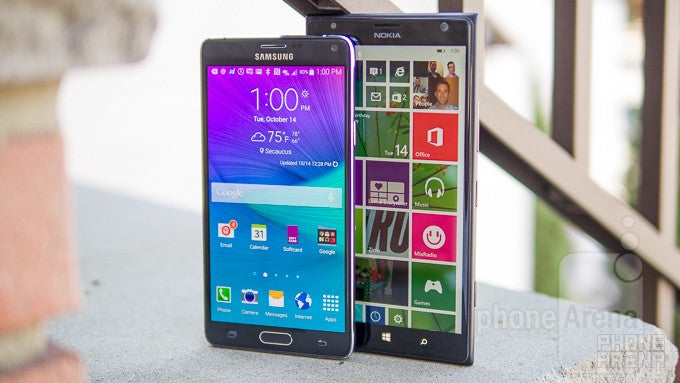
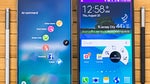
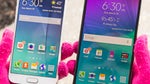
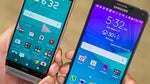
Both have phablet size, but the Lumia 1520 is significantly larger.
Obviously, we’re dealing with phablets here, due to their hand crushing sizes. However, the Lumia 1520 is significantly harder to manage due to its even larger overall size and heavier weight – and it doesn’t help either that its corners are a bit pointy. Despite that, it still has a stylish edge over the Note 4, thanks in part to the way it’s tapered around its edges. On top of that, it has a more profound solid construction as well.

6.04 x 3.09 x 0.33 inches
153.5 x 78.6 x 8.5 mm
6.21 oz (176 g)

6.41 x 3.36 x 0.34 inches
162.8 x 85.4 x 8.7 mm
7.37 oz (209 g)

6.04 x 3.09 x 0.33 inches
153.5 x 78.6 x 8.5 mm
6.21 oz (176 g)

6.41 x 3.36 x 0.34 inches
162.8 x 85.4 x 8.7 mm
7.37 oz (209 g)
See the full Samsung Galaxy Note4 vs Nokia Lumia 1520 size comparison or compare them to other phones using our Size Comparison tool.
Display
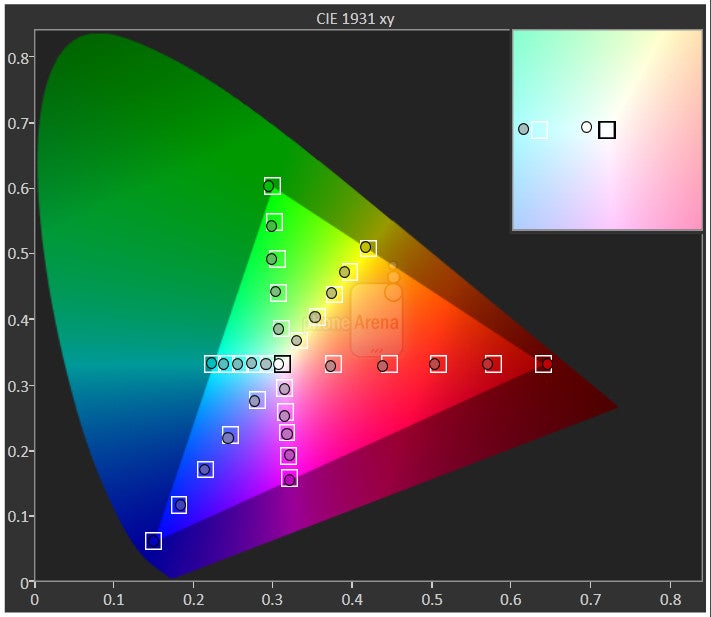
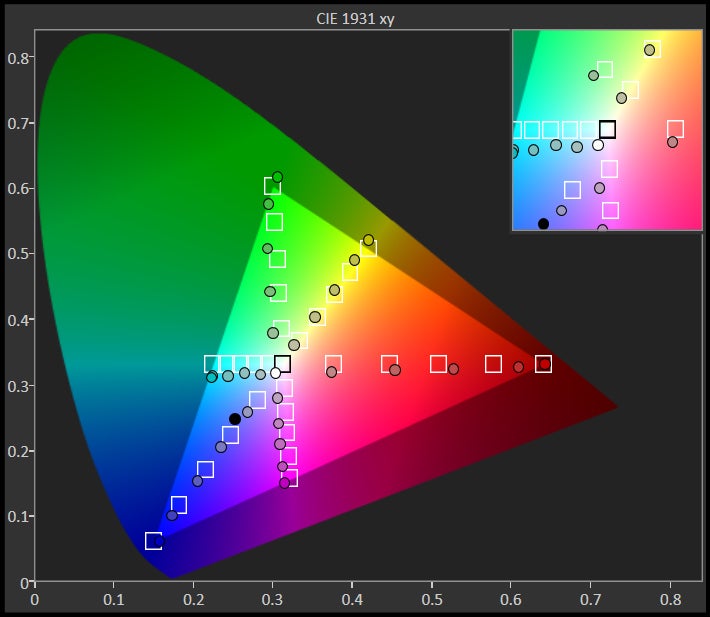
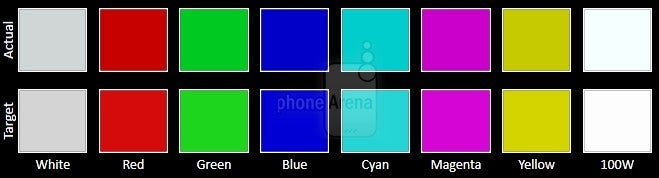
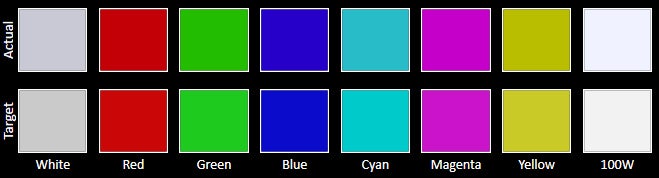
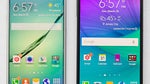
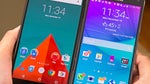
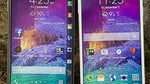
The Note 4 has ultra high-resolution and accurate colors while the Lumia 1520's display is slightly larger.
We tip our hat to the Note 4’s display, which not only stands out for its impeccable detail, but also for its accurate color reproduction, wide viewing angles, and showroom wow factor. Donning a 5.7-inch 1440 x 2560 Super AMOLED display, there’s no denying the amount of detail it’s able to deliver with its pixel density count of 515 ppi. In contrast, the Lumia 1520’s larger sized 6-inch 1080 x 1920 IPS LCD display is still pretty sharp with its 368 ppi pixel density, but we’ve been spoiled by the Note 4’s quad-HD resolution. However, we will mention that the Lumia 1520’s display is more visible outdoors, since it achieves a maximum brightness output of 707 nits – beating out the Note 4’s tally of 468 nits.


Interface and Functionality
The Note 4 proves valuable in being the ultimate productivity tool, one that’s rich in software features that help us to get work completed.
With the update to Windows Phone 8.1, the Lumia 1520 feels like a totally different phone from when it first launched. As a whole, the new features in tow with the update help it to become just as versatile as Android. However, the Note 4’s TouchWiz experience catapults it by paying special attention in meeting the demands of power users. Unfortunately, there aren’t any major enhancements to the Lumia 1520’s experience that separates it from non-phablets – so it’s the same exact experience as other Windows Phones.
Interface of the Nokia Lumia 1520
What makes the Note 4 so special, is that the experience is elevated thanks in part to a combination of several things – both hardware and software. Using the S Pen enables us to jot down notes, add quick remarks to an email, and even give us that desktop-like web surfing experience thanks to its hovering feature. In addition to that, Multi-Window offers true multi-tasking in the way that two apps can be running simultaneously on one screen. And if that’s not enough for you, most native apps with the Note 4 have optimized layouts in landscape to make the most out of the larger display.
The UI of the Samsung Galaxy Note 4
Overall, the Note 4’s experience is undeniably more mature, refined, and downright versatile. Don’t get us wrong, Windows Phone 8.1 is visually stunning and receives some much-needed modern features, but there are no enhancements whatsoever to give the Lumia 1520 an experience that adheres to the phablet form factor.
Processor and Memory
For being a one-year old model, the Lumia 1520 rivals the real-world performance of the newer Note 4.
Despite being powered by an older processor, a quad-core 2.2GHz Qualcomm Snapdragon 800 SoC with 2GB of RAM, the Lumia 1520 is still a peppy and responsive thing. In fact, it’s sometimes hard to see any differences against the Note 4’s newer quad-core 2.7GHz Qualcomm Snapdragon 805 SoC with 3GB of RAM.
Internet and Connectivity
On the surface, we can’t complain about the web surfing experience with either smartphone, just because they offer 4G LTE connectivity, instant page rendering, and smooth navigational controls. As much as we appreciate the extra real estate with the Lumia 1520, we actually find the Note 4 being more versatile for the occasion – thanks in part to the superb detail of its display, the precision in selecting something with the S Pen, and how it offers a hovering function as well.
Web browsing on the Samsung Galaxy Note 4
The web experience on the Nokia Lumia 1520
Sharing similar radios, these two are compatible to work on most GSM networks around the world, but being the newer device, the Note 4 benefits from having a wider band support with LTE. Beyond that, they offer pretty much the usual set of connectivity features – like aGPS with Glonass, Bluetooth (4.1 for the Note 4, 4.0 with the Lumia 1520), dual-band 802.11 a/b/g/n/ac Wi-Fi, and NFC. However, the Note 4 packs a useful IR blaster, which allows it to double as a universal remote.
Camera
The Lumia 1520 has always been an outstanding camera performer, but the Note 4 proves that it’s just as good – if not, better.
This is where things get interesting, since they offer some pretty outstanding cameras. Always one to impress, even now, the Lumia 1520 stands out primarily for its 20-megapixel PureView camera, which features a 1/2.5” sensor, f/2.4 aperture lens, dual-LED flash, optical image stabilization, and 1080p video recording. Don’t be fooled either by the Note 4’s 16-megapixel 1/2.6” sensor, that’s because it’s accompanied by an f/2.0 aperture lens, optical image stabilization, LED flash, and up to 4K video recording.
The camera interface of the Samsung Galaxy Note 4
Camera interface of the Nokia Lumia 1520
There’s no arguing that they capture some amazing details, that’s for sure, seeing that we can crop photos without losing significant level of detail. Quite frankly, we’re impressed by how some of the Note 4’s samples come out sharper than the Lumia 1520 outdoors when lighting is plentiful. However, it boggles our mind to see such a huge disparity under low lighting condition, as the Note 4’s shots are brighter, less noisy, and simply sharper. Needless to say, we recommend both phones for their cameras, but there’s a little bit more to like with the Note 4.
Sample images
Their still image qualities rival one another closely, but it’s a one-sided victory for the Note 4 when it comes to video recording. Undoubtedly, the Lumia 1520’s quality is rather disappointing, since details are significantly softer – whereas it’s in abundance with the Note 4. Better yet, there’s even more detail seen with the Note 4’s 4K video recording, which proves that it’s the more features rich camera.
Sample Videos
Multimedia
If you love watching videos, you won’t be disappointed by what they have to offer.
On the audio side, we can’t complain about the music players available to them, since they’re functional in getting the task complete. Cranking up their speaker volumes, it’s quite noticeable that they’re pretty powerful, although, they each have their own unsavory qualities. Specifically, the Note 4’s speaker sounds thin and distorted – while the Lumia 1520 produces a hollow tone.
Music player of the Samsung Galaxy Note 4
The Lumia 1520 offer a choice between Windows Phone music player or Nokia Music
Being phablets, they’re ideal for the video watching experience, mainly because of their ginormous displays. However, we appreciate the multi-tasking element that’s available to us with the Note 4 – where we can play a video and do something else at the same time.
Call Quality
The Note 4 proves to offer the better call quality performance.
Call quality is a smidgen better with the Note 4, as voices on both ends of the line are deep and natural in tone. Due to its weak earpiece, as well as the hollow tone with voices through its speakerphone, the Lumia 1520 isn’t as good in this particular department.
Battery
Gigantic phones deserve gigantic batteries, you won’t be disappointed by their long-lasting performances.
Power users have nothing to worry about, since the 3400 mAh battery of the Lumia 1520, and the 3220 mAh one in the Note 4, deliver outstanding battery life that’ll keep them going throughout the day. With normal usage, in fact, we’re able to get roughly 1.5 days out of them.
Conclusion
When we think of phablets, we expect an experience that makes good use of the extra real estate they’re blessed with. Bearing that in mind, that’s what makes the Note 4 the superior phablet – one that not only boasts rich features and impressive specs, but it adheres to the needs of productivity centric users.
Well, the Nokia Lumia 1520 is still a fantastic thing to think about, especially in the Windows Phone camp. Its biggest strength now, aside from its great camera, is the low cost that’s attached to it – where you can find it for as low as free with a 2-year contract. Conversely, you’re going to pay a cool $300 to pick up the Note 4 on-contract, but the money invested in it shows whys it’s a premium thing from head-to-toe.
Popular stories


Latest News

Things that are NOT allowed:
To help keep our community safe and free from spam, we apply temporary limits to newly created accounts: