Asus ZenFone 4 Selfie Pro Review
You can now read:
Introduction
The selfie-oriented niche may be a small one, but still active. Every now and then a manufacturer will launch a phone with a high-resolution front camera, assisted by an LED flash, and some software enhancements to boost your self-made mugshots. Today, we take a look at the Asus ZenFone 4 Selfie Pro. As you are probably guessing by the name, it's a phone that wants to appeal to the social-networking, selfie-loving crowd. This one ups the ante with a secondary, wide-angle selfie camera on the front, and a Portrait Mode for both the front- and rear-facing snappers.
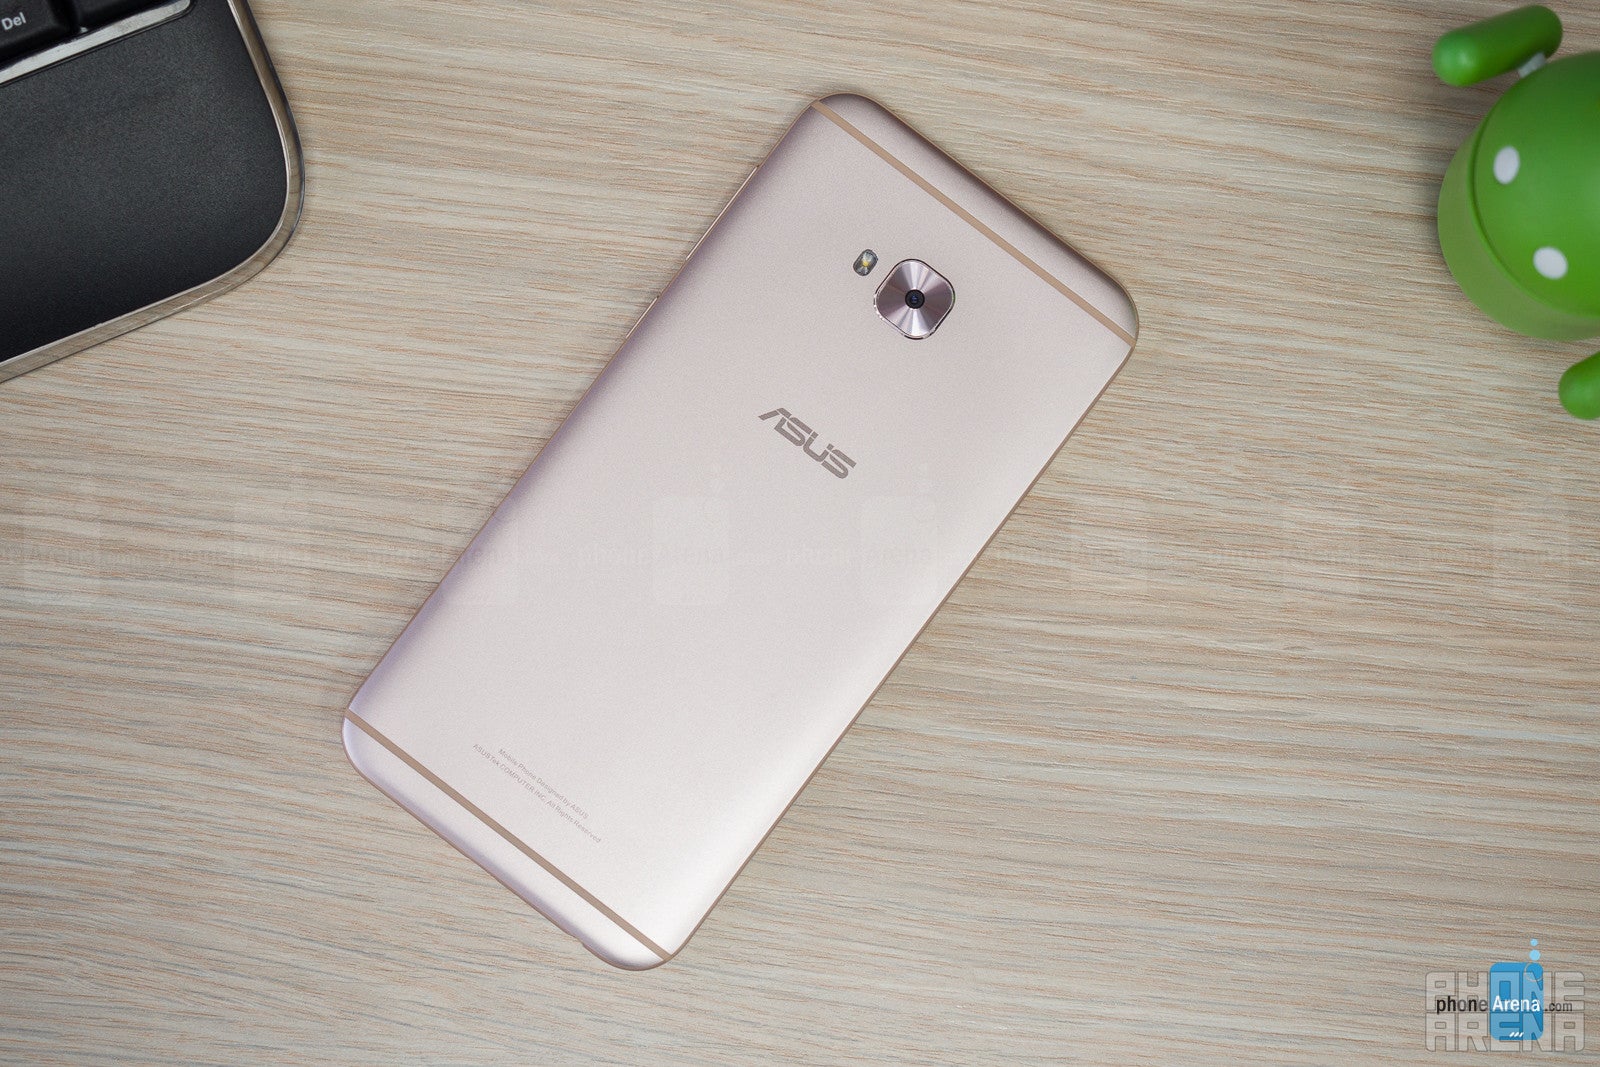
Design
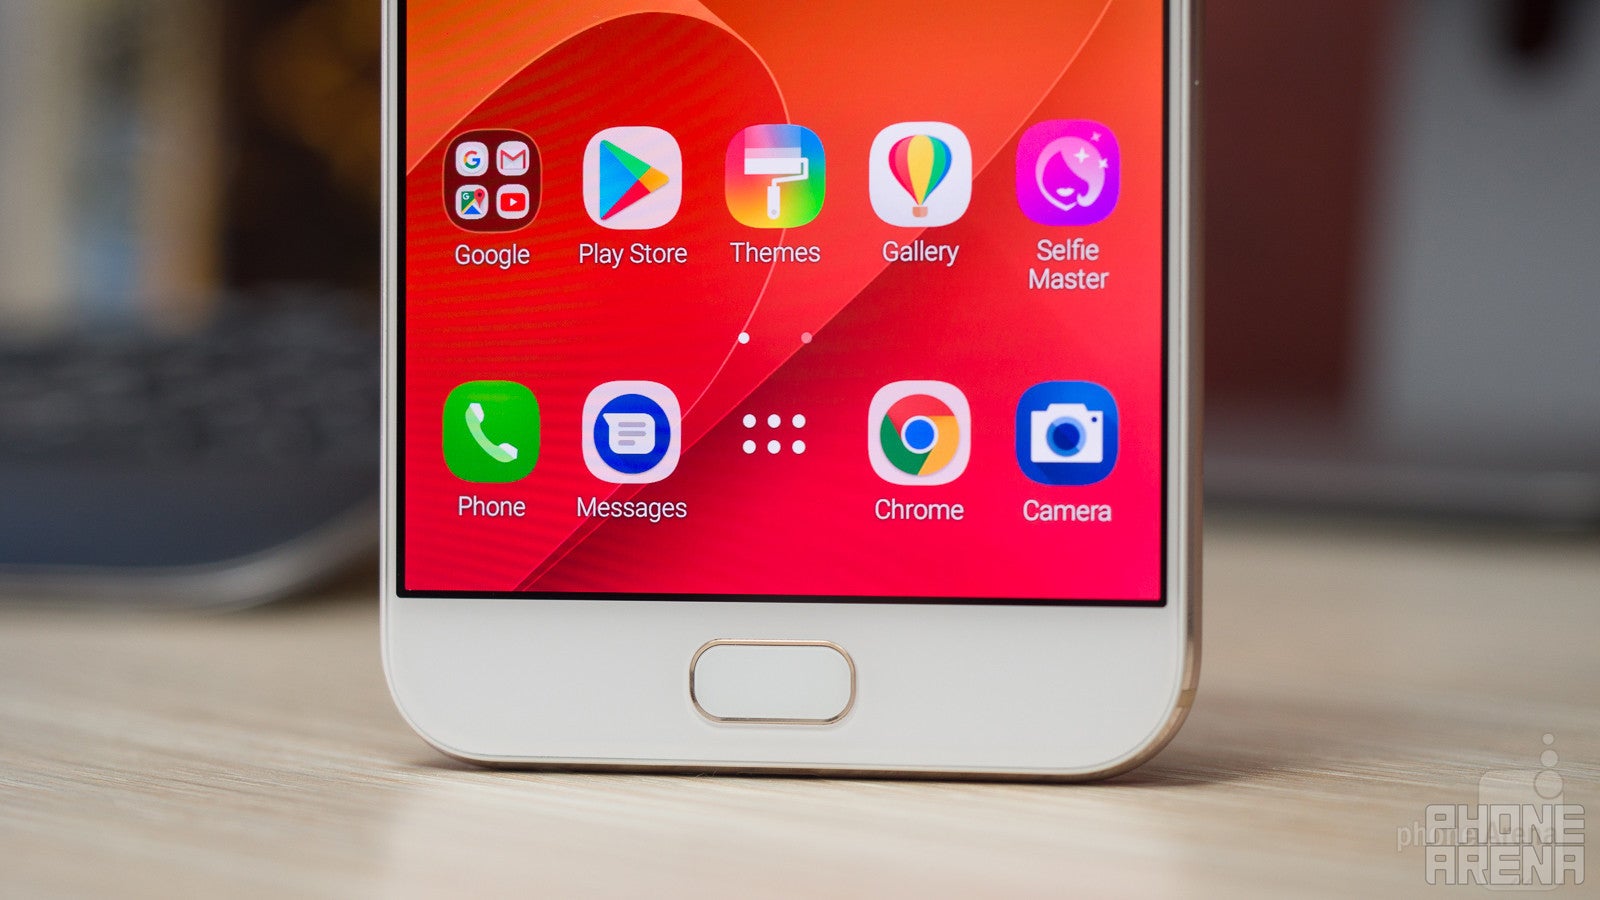
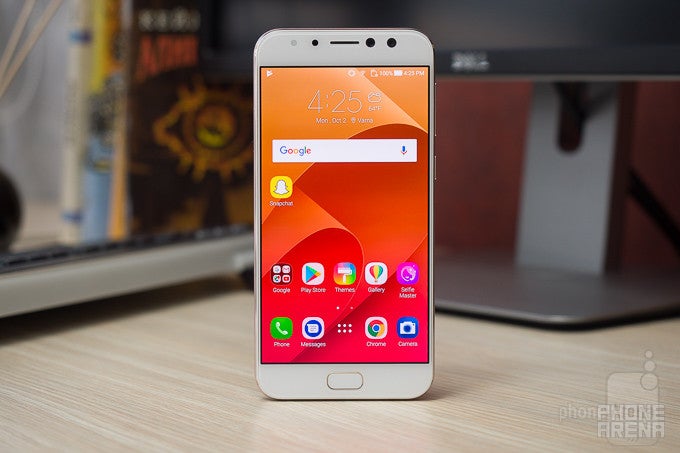
When first laying eyes on the ZenFone 4 Selfie Pro, one is met with a pleasant, contemporary design. The device is wrapped in matte-finished metal and has a thin profile, which feels quite pleasant in the hand. The home button on the bottom is a capacitive plaque, which also doubles as a fingerprint scanner. We've got backlit "back" and "recent apps" buttons surrounding it.
The power button and volume rocker are both placed on the right, with the latter being just a tad bit higher than we would've liked. Still, all controls are in a reasonably reachable spot. The physical buttons have a very reassuring click to them, though they're just a bit shallow.

6.06 x 2.95 x 0.27 inches
153.9 x 74.9 x 6.9 mm
5.19 oz (147 g)

5.91 x 2.91 x 0.38 inches
150.2 x 74 x 9.7 mm
5.47 oz (155 g)

5.71 x 2.64 x 0.31 inches
145 x 67 x 8 mm
5.04 oz (143 g)

6.17 x 3.06 x 0.31 inches
156.8 x 77.6 x 7.9 mm
6.56 oz (186 g)

6.06 x 2.95 x 0.27 inches
153.9 x 74.9 x 6.9 mm
5.19 oz (147 g)

5.91 x 2.91 x 0.38 inches
150.2 x 74 x 9.7 mm
5.47 oz (155 g)

5.71 x 2.64 x 0.31 inches
145 x 67 x 8 mm
5.04 oz (143 g)

6.17 x 3.06 x 0.31 inches
156.8 x 77.6 x 7.9 mm
6.56 oz (186 g)
Compare these and other phones using our Size Comparison tool.
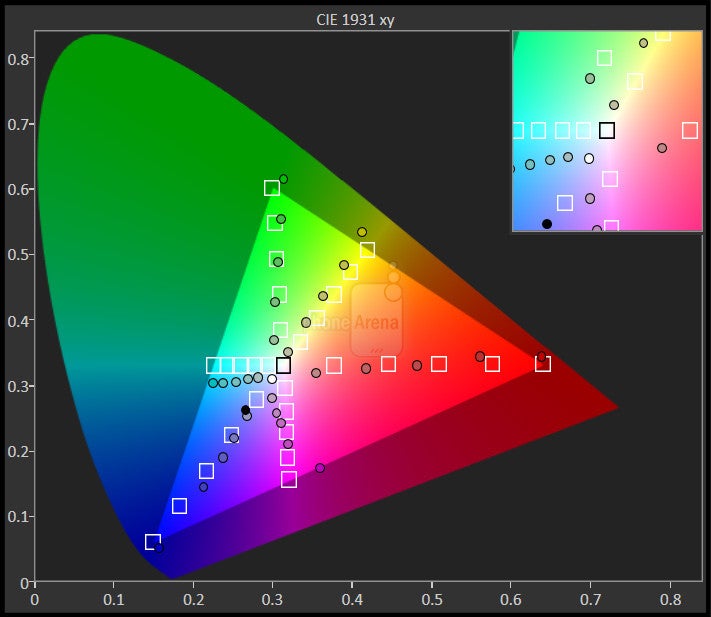
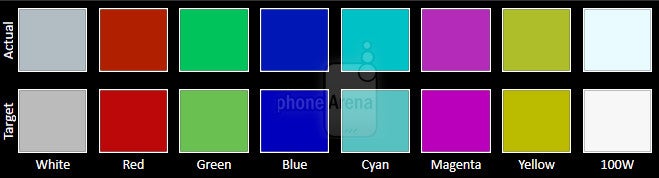
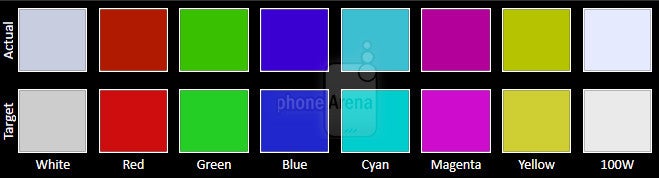
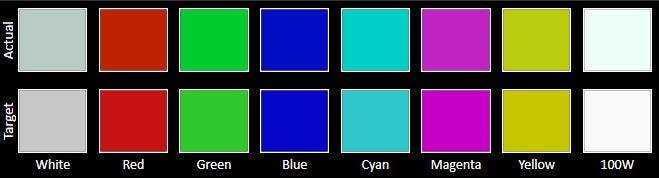
Display
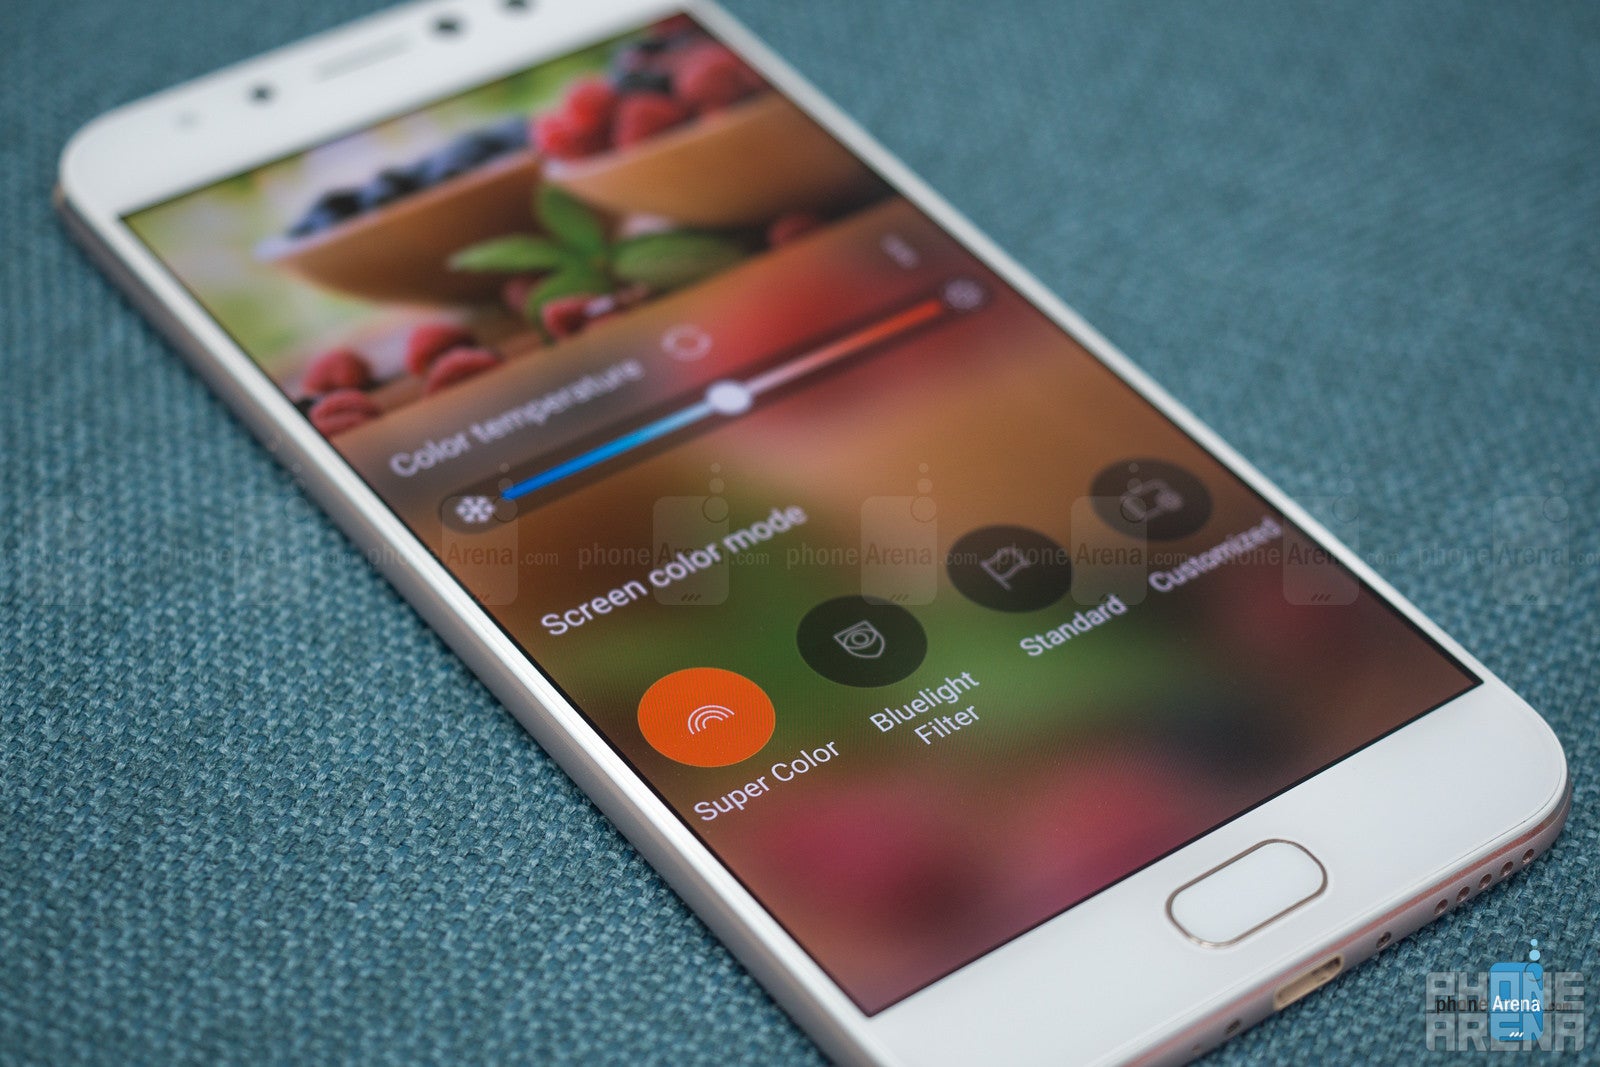
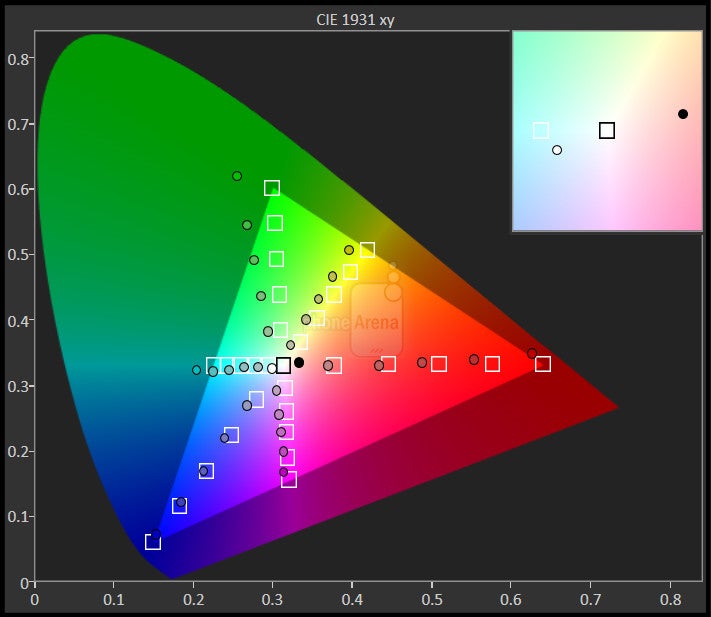
In short, if not entirely color-accurate, the display is a pleasure to look at and covers a variety of tastes. Unfortunately, it doesn't get very bright, so viewing out in the sunlight is not always a great experience.


Interface and functionality
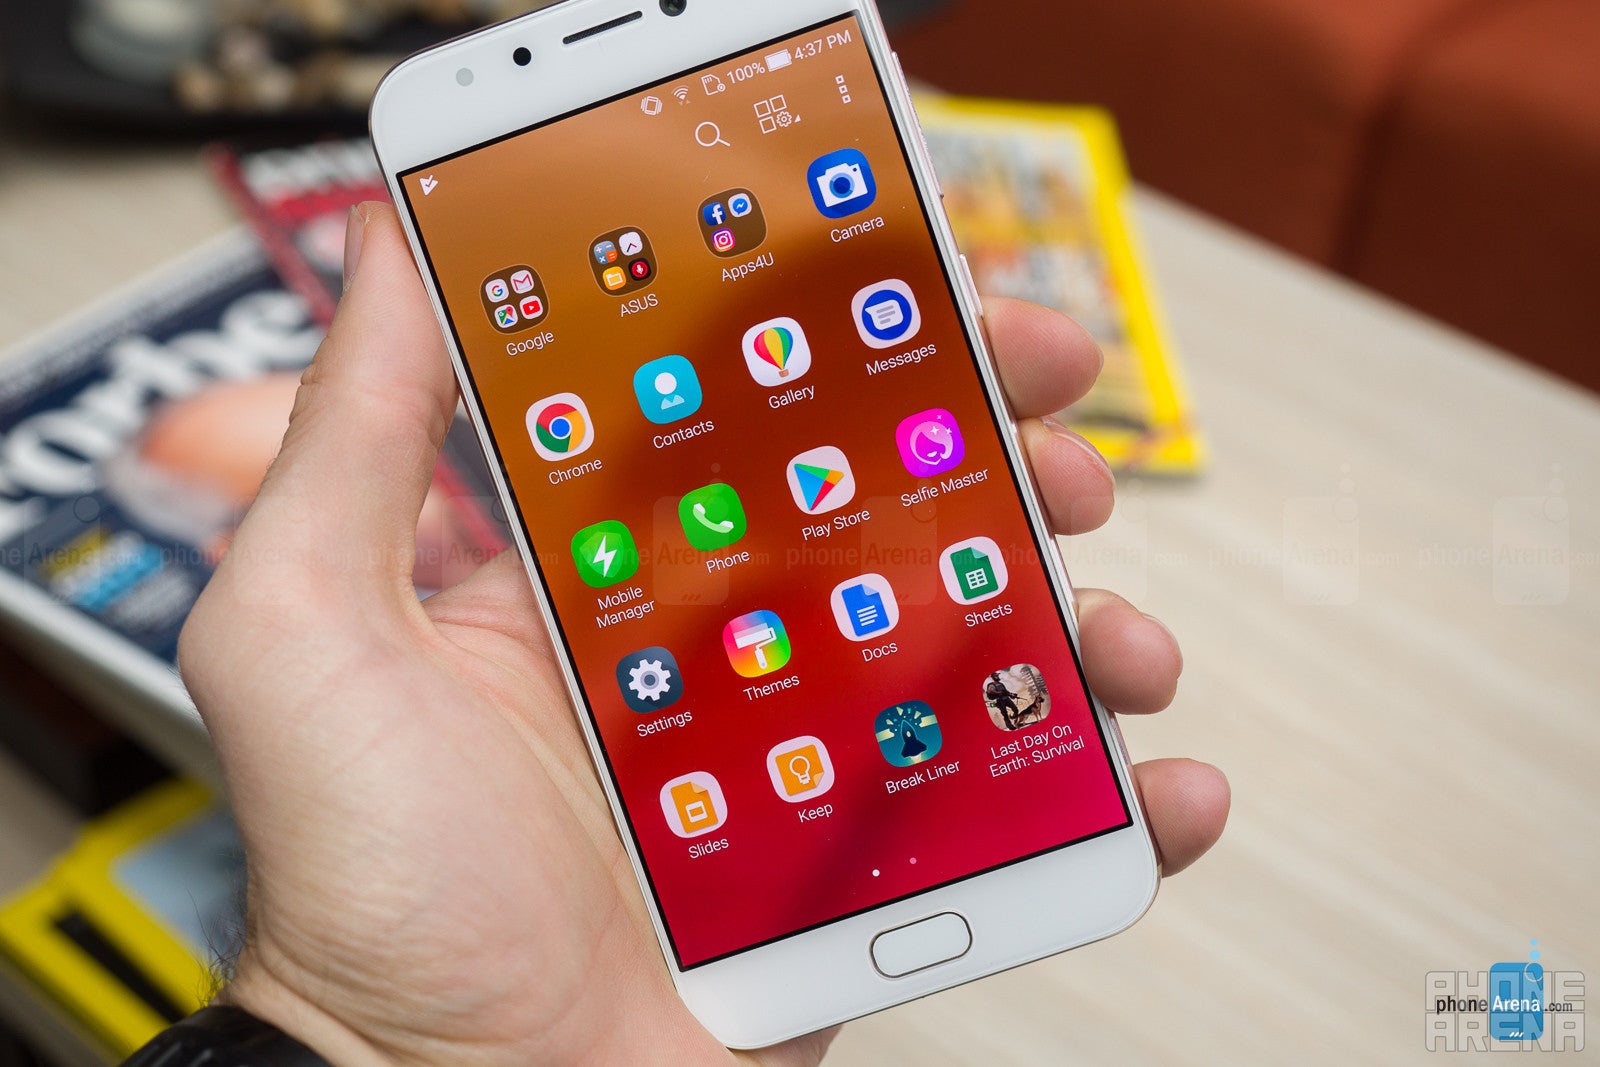
Asus puts its own ZenUI interface on top of Android. Here, we've got ZenUI 4 on top of Android 7.1.1 Nougat. At first, it looks like it might be a heavy reskin that drags the performance down, but it is actually quite light. Operation is fluid and the animations all move with a pleasant swoosh.
Of course, it wouldn't be called the Selfie Pro unless we had an app that makes use of the frontal camera. The Selfie Master lets us apply 10 levels of skin smoothing to our selfie camera footage in real time. Then, we can shoot a photo, record a video, or even broadcast live with the filter applied. The phone's gallery also has a built-in photo editor, which has a few other popular face-enhancing features, like wide-eyes, lipstick application, and other glamour effects.
Processor and performance
The Pro in Selfie Pro means we've got a bit more oomph in the hardware department when compared to the regular ZenFone 4 Selfie. So, the processor is a Qualcomm Snapdragon 625, clocked at 2 GHz and coupled with 4 GB of RAM. The phone has 64 GB of storage, 50 GB of which are available to the user and, if that's not enough, we can expand it with a microSD card of up to 2 GB.
It's not cutting-edge hardware, but we found that the ZenFone 4 Selfie Pro runs quite nice for your regular, everyday usage. Websites load and scroll fine, most mobile games are playable just fine without annoying levels of input lag or anything like that. Selfie-centric apps like Snapchat with their heavy live lens effects also showed no stutters or hiccups.
Camera
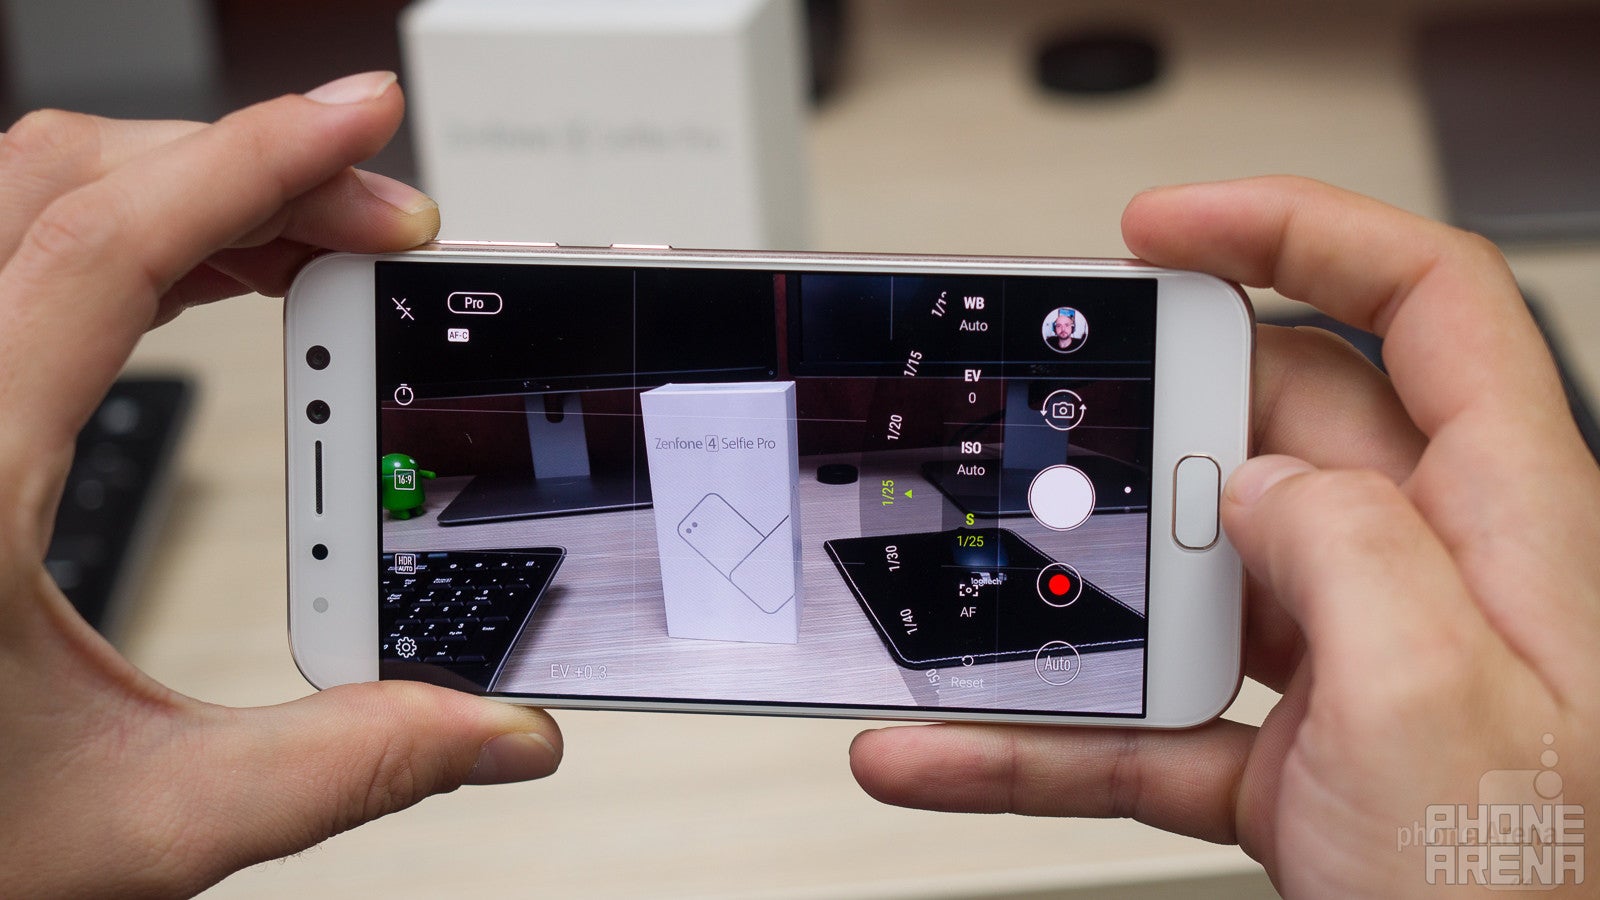
Camera interface
When a phone is called the Selfie Pro, you'd expect that its cameras are something special, specifically on the front. So, the ZenFone 4 Selfie pro has a 16 MP main camera, a 12 MP front-facing sensor, which can take 24 MP photos via some magic, and a secondary, 5 MP selfie camera with a 120° wide-angle lens. To top it off, we have a DSLR-emulating Portrait Mode, which promises beautiful bokeh behind our subject. Sounds great on paper. How does it perform?
The details that come from the main camera are quite sharp — a pleasure to look at, even. Color reproduction is mostly accurate, but can sometimes be too cold or washed out. We took the phone out on a cloudy day — we had plenty of light with no direct sunlight — and it still struggled with keeping highlights from burning out and shadows from disappearing in a deep black. It's also worth noting that if HDR is left at auto, the phone seems to pick the weirdest moments to turn it on (one time, we pointed the viewfinder at the gravel-covered ground and HDR kicked in, for example). The HDR itself is not terrible, but it's also far from the best. Sometimes, it does very little to save the highlights, yet it boosts colors and shadows in such a way that the image looks a bit flat and unnatural. You can check it out in photos 3, 6, 8, 12, 15 and 23.
The lack of an optical image stabilization means that you need to keep steady, especially when you shoot indoors. It's quite easy to get a blurred photo with this phone, but we admit we are spoiled by the many OIS-equipped phones we've handled.
OK, let's go to the front cameras — this phone is all about the selfies, after all. The “main” front snapper has a 12 MP sensor and it performs just as well as the back-mounted camera — details are OK but shaky hands are your mortal enemy; colors are usually accurate if a bit cold. Sometimes it goes haywire and adds way too much green — photos 23 and 24. The dynamic range here is also pretty bad — highlights are easy to burn out and if you happen to be wearing a dark shirt, it could easily turn into a big, black spot in your selfie.
What about that 24 MP DuoPixel mode? The Asus ZenFone 4 Selfie Pro has a 12 MP Sony IMX362 sensor, which employs two photodiodes under each pixel. So, Asus uses some algorithm magic to split the information from the pixels and stitch it together for large 24 MP selfies. Sounds interesting on paper, but while we do get larger photos, we wouldn't say they are more detailed. The process requires you to stand extra, extra steady during the snapping — even more than for a standard HDR photo. Naturally, getting a picture with no blur is a hard task, which we failed at a few times.
Asus ZenFone 4 Selfie Pro sample images
The wide-angle camera on the front was actually a pleasant surprise. While it has an inferior resolution of 5 MP, it produces warmer, more pleasing colors. It's also very light on the fisheye effect so you don't feel like a photo has been ruined by the wider angle. However, it's lower resolution is instantly apparent when compared to shots with the "main" selfie camera.
What about that Portrait Mode? Well, don't expect something as advanced as the one on the Galaxy Note 8 or iPhone 8 Plus for sure. It just applies a dreamy blur around your subject and is very, very rough while doing so. Its effect is more along the lines of “dirty lens” than “DSLR emulation”. It also only works if it detects a human face in the picture, so forget about making artsy pet shots.
As for video recording, we can do 1920 x 1080 (FHD) at 60 FPS or go up to 3840 x 2160 (4K UHD) at 30 FPS. The camcorder suffers from the same issues the photos do — we've got a very limited dynamic range and the lack of stabilization is even more noticeable. But the detail is pretty good — check out the close-up on the keys in the 4K clip.
Asus ZenFone 4 Selfie Pro Sample Videos
Battery life
The Asus ZenFone 4 Selfie Pro has a 3,000 mAh battery in that slim body. And, we have to say, it's a marathon-runner for sure. Even after testing it with games and taking it out for a photo shoot, the battery still had enough charge to take us through a whole day.
Conclusion
The Asus ZenFone 4 Selfie Pro is certainly not a bad phone. Its hardware is just right for an upper-midrange device, its user interface is smooth and its customizations are actually fun to play around with. Its thin profile and metal build make it look and feel like a premium handset, yet it still holds a rather large battery and definitely lasts a while. Its display is a pleasure to look at and can be set to taste, whether you love super-punchy colors or soft and subdued ones.
But we can't help but judge it on its promise of a great camera.
Its photos may be detailed, but are mediocre in all other aspects. The DuoPixel 24 MP and Portrait Mode features are mostly there to fill a spec sheet. We did enjoy the wide-angle selfie camera, but it's just not enough to save the phone.
These features sound like they should justify a $380 price-tag, but seeing how usable they are, we'd say they don't. If anything, we'd say the ZenFone 4 Selfie Pro's strongest points are its physical look and feel, and if you decide to buy it for that — go right ahead.
Meanwhile, we've got the people's champions — the Moto G5 Plus ($229) and Moto G5S Plus ($279.99) — with the same hardware, clean Android experience, and lower prices making it hard to talk about the ZenFone without mentioning them as alternatives.
You can now read:

Popular stories


Latest News

Things that are NOT allowed:
To help keep our community safe and free from spam, we apply temporary limits to newly created accounts: