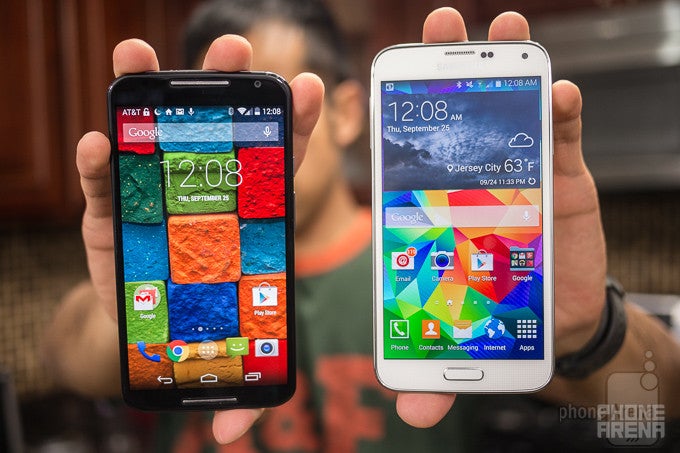
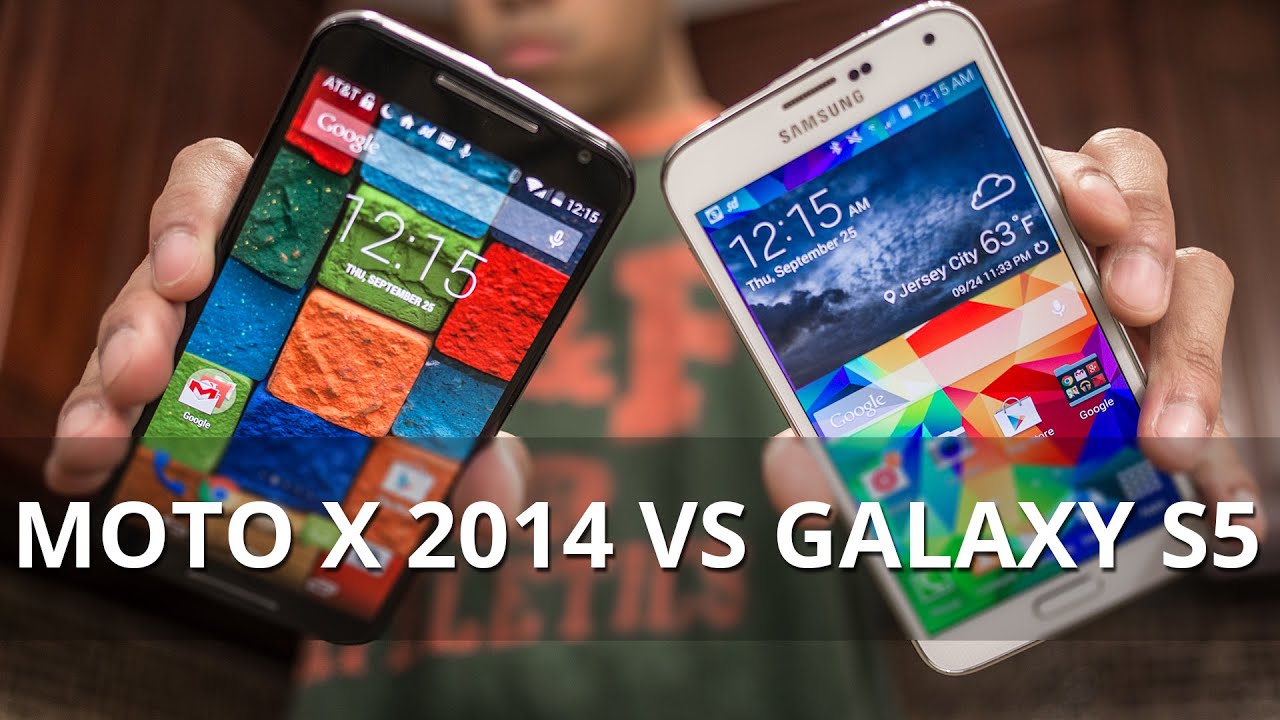
Motorola Moto X 2014 vs Samsung Galaxy S5

Introduction
Now that Motorola’s flagship phone for 2014 is finally out, it’s time to pit it against the handset that’s arguably the reigning champion in the Android smartphone space – the Samsung Galaxy S5. Always a formidable contender, the Galaxy S5 somehow manages to continue beating its rivals in several departments. Motorola has surely tweaked its Moto X to become a device indicative of a flagship, whereas last year’s model felt more like a mid-ranger in some aspects, so we’re anxious to see if all of its hard work pays off in knocking out the Samsung Galaxy S5 from its pedestal.
Design
When it comes to style and construction, the Moto X undoubtedly exhibits all of those qualities to make it the more appealing handset – plus, it helps when its design can be customized to the teeth. Indeed, the two are comprised out of plastic, but the kind used by the Moto X, combined with its aluminum frame, gives it a lovable premium quality to overpower the subdued look of the Galaxy S5. Let's not forget that we can customize the Moto X with leather or wood back, giving it that unique premium feel. Despite that, we’ll applaud Sammy for giving its smartphone a water-resistant casing capable of being submerged under water for a short period of time, which definitely comes in handy with certain situations.

5.54 x 2.85 x 0.39 inches
140.8 x 72.4 x 9.9 mm
5.08 oz (144 g)

5.59 x 2.85 x 0.32 inches
142 x 72.5 x 8.1 mm
5.11 oz (145 g)

5.54 x 2.85 x 0.39 inches
140.8 x 72.4 x 9.9 mm
5.08 oz (144 g)

5.59 x 2.85 x 0.32 inches
142 x 72.5 x 8.1 mm
5.11 oz (145 g)
See the full Motorola Moto X (2014) vs Samsung Galaxy S5 size comparison or compare them to other phones using our Size Comparison tool.
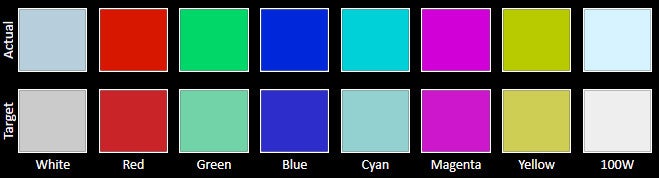
Display
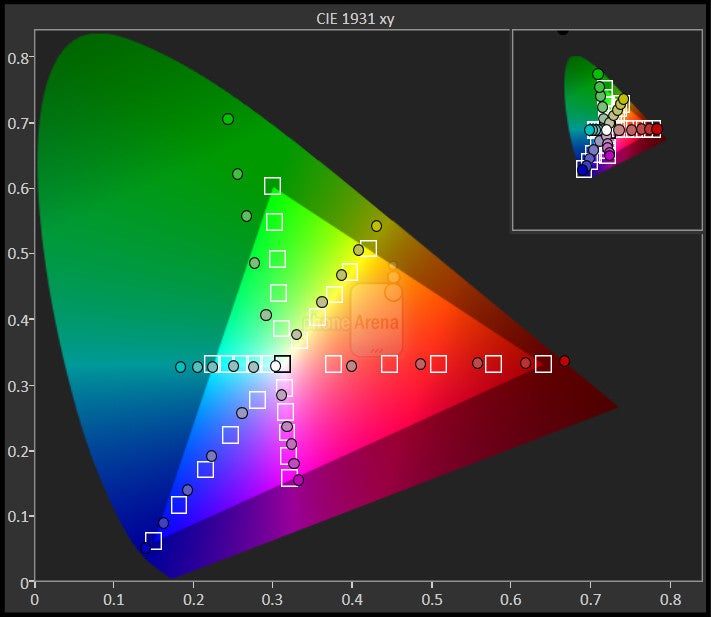
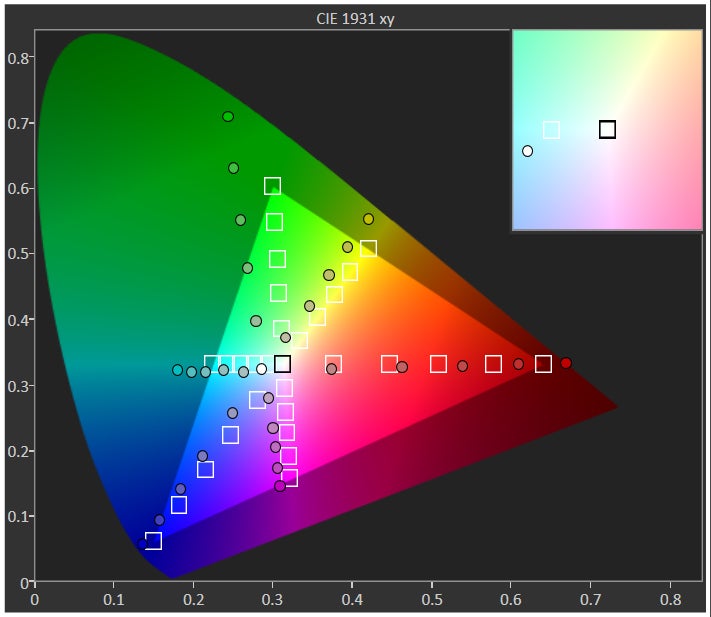
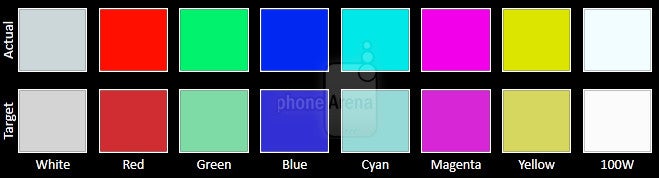
Checking out their displays, there’s not one in particular we’re fonder of over the other. The Moto X uses a 5.2-inch 1080 x 1920 AMOLED display – while the Galaxy S5 is outfitted with a 5.1-inch 1080 x 1920 Super AMOLED screen. In the details department, they both have rich and crisp details to allow us to distinguish miniscule sized text.Max brightness isn’t great with either of them, as the Moto X and Galaxy S5 respectively deliver maximum outputs of 385 and 442 nits. Since they’re based on AMOLED technology, they offer the same superb viewing angles and over-saturated color production. Neither is actually great in accurately reproducing true colors, but at least with the Galaxy S5, we can modify its color output to give it a more natural quality.


Interface and Functionality
These two couldn’t be any farther from one another when it comes to their respective Android experiences. Simplified and unobtrusive experience is something we absolutely get from the stock Android 4.4.4 KitKat experience running in the new Moto X. It’s a stark contrast to the features-rich experience of Sammy’s TouchWiz UI, since Motorola doesn’t try to overwhelm us with software features.
In particular, its Moto Display, Moto Assist, Moto Actions, and Moto Voice are all services that enhance our way of interacting with the phone. For example, the always-on feature of Moto Voice enables us to access all of Google Now’s functionality with the aid of our voice – so it proves handy in situations when we’re preoccupied, like driving.
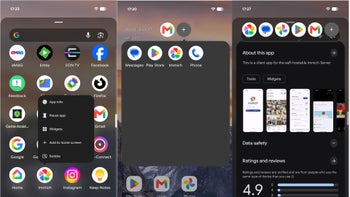
UI of the Motorola Moto X (2014)
Conversely, the TouchWiz interface of the Galaxy S5 is riddled with an assortment of features – to the point that they can sometimes overwhelm us. Still, some people prefer the more is good mentality. Nonetheless, there are certain things we find appreciable – like how it has a more enhanced multi-tasking experience with its multi-windows feature. Luckily, Sammy has toned down thing with this year’s smartphone, but it’s still a lot to absorb for the average person.
UI of the Samsung Galaxy S5
Beyond the functions and features of their experiences, the visuals are drastically different from one another. Although Sammy tries to paint a picture of nature with TouchWiz, it still comes off as a bit cartoony – as opposed to the cleaner look of stock Android running on over the Moto X.
Processor and Memory
True to being flagship smartphones, these two are powered by the same 2.5GHz Qualcomm Snapdragon 801 SoC coupled with 2GB of RAM and the Adreno 330 GPU. Superficially, these two deliver the same responsiveness with basic tasks, but there’s a little bit more of that snappiness seen with the Moto X’s performance. Regardless, they’re both more than equipped to running all of today’s demanding 3D mobile games.
Boasting 32GB of storage, most people will find their tallies to be sufficient, but it irks us to know that the Moto X lacks a microSD slot – something that’s quite common amongst other flagships, just like the Galaxy S5.
Internet and Connectivity
Enjoyable to say the least, especially with their fast 4G LTE connections and snappy responses, Sammy throws in some added software features that some might find useful, like Air Browse, which allows us to wave our hand over the display to scroll vertically. We’re not too keen on using this a whole lot, especially when scrolling via our finger is more than effective, but again, some people will like the added functionality.
Web browsers
Since they rival one another, they’re packing the same set of connectivity features – they consist of aGPS with Glonass, Bluetooth 4.0, dual-band 802.11 a/b/g/n/ac Wi-Fi, and NFC. Adding to its arsenal, the Galaxy S5 packs along an IR blaster, which is yet another fitting item we tend to see in today’s flagship smartphones.
Camera
If you love having complete control in everything you capture, you’ll especially like the Galaxy S5’s camera interface a whole lot more. That’s because it’s rich with manual controls and shooting modes, whereas the Moto X’s interface presents us with HDR and panoramic modes only. In the hardware department, the Galaxy S5’s 16-megapixel has always been a top-contender, so it’s interesting to find out how the Moto X’s 13-megapixel one can stack up.
Camera interface of the Motorola Moto X
The camera app of the Samsung Galaxy S5
To the untrained eye, the qualities from these two cameras might appear very similar on the surface, especially if we’re to make 4” x 6” printouts, but there are differences that make the Galaxy S5 superior. First and foremost, it catches slightly more detail, but most profound is its better job at casting a very neutral exposure – whereas it’s slightly over-exposed with the Moto X. Under low light, the Galaxy S5 again proves its superiority for having the brighter photos, allowing details to be exposed more than the Moto X.
Sample images
At the same time, we prefer the Galaxy S5’s 1080p video recording too, due to its sharper overall looks and crisper audio recording. Well, it’s not bad with the Moto X either, but it’s not as good looking to the eye.
Sample Videos
Multimedia
Listening to music can be done with the Google Music Play app on both devices, but as an alternative, the Galaxy S5 also bears the TouchWiz player as well. Cranking out audio through their respective speakers, we find that the Galaxy S5’s rear firing one produces a stronger output of 81 dB – in comparison to the lower 75.4 dB tally of the Moto X’s front firing one.
Music players
Honestly, we love the video watching experience with both phones, seeing that their AMOLED-based displays have that attractive warm glow to them. However, the Galaxy S5 packs some useful features, like being able to play a video on top of whatever we’re doing, that give us more flexibility out of the box.
Call Quality
Motorola really outdid itself by giving the Moto X a total of microphones around its body, which lends in providing it with the superior call quality – one that’s rich in tone on our end, and robust on the other. Meanwhile, the Galaxy S5 is an average performer in this category, so we’re inclined to ask our callers to make some repetitions when necessary.
Battery
Based on experience, higher capacity batteries tend to deliver longer battery life. Keeping that in mind, it doesn’t shock us to find that the Galaxy S5’s 2800 mAh battery offers us the longer tally – 7 hours, 38 minutes in our benchmark test. Sadly, the Moto X’s smaller 2200 mAh battery can’t compare with its mark of 5 hours, 45 minutes.
Conclusion
There’s a reason why the Samsung Galaxy S5 continues to be a noteworthy smartphone, despite the fact that it’s been out for some time now. Frankly, it just works in being a high performing smartphone – one that’s usually a top finisher in key categories. From its superior battery life, sharp camera quality, and its rich set of software features, the Galaxy S5 is without a doubt a few steps ahead of the Moto X.
Even though Motorola has made some tweaks to enhance the Moto X over its predecessor, it can’t stop the steamrolling action of its rival. Still, we’ll hand it to Motorola for designing one heck of a beautiful phone, one that’s customizable and premium – plus, its $100 on-contract cost from the onset is pretty attractive too.
Then again, we’re pretty sure that the Galaxy S5 can be picked up at or nearly around the same price point now, so it’s just as valuable as its new competitor. Unless you’re all about design, we’d suggest picking up the Galaxy S5 for its supreme performance.
Popular stories


Latest News


Things that are NOT allowed:
To help keep our community safe and free from spam, we apply temporary limits to newly created accounts: