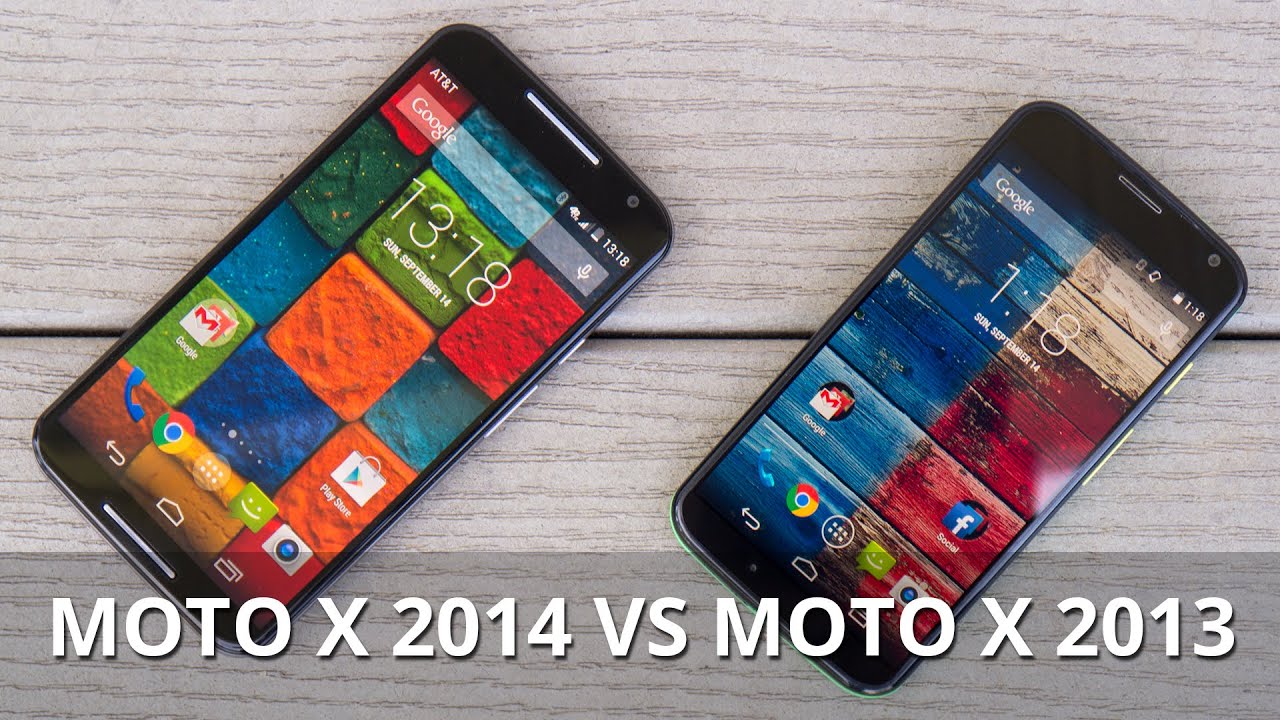
Motorola Moto X 2014 vs Moto X 2013
Introduction
Motorola surely established something in the smartphone industry that we haven’t seen in a grand scale when the Moto X arrived on the scene last year to much acclaim. Not only did it present us with a venerable Android smartphone that could be customized in several ways, from its case options to accent colors, but it also proved to many that simplicity and functionality are two things that go hand-in-hand in making a smartphone legendary. Well, the new Moto X, the 2014 version, receives all the evolutionary upgrades we’d expect with any successor, but how much better is it than its predecessor?
Design
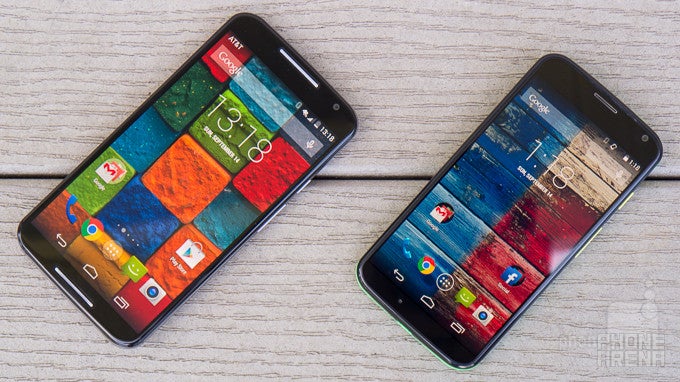
Obviously, the biggest design difference here is the new Moto X’s larger size, which depending on your taste, might be a good or bad thing. Indeed, it’s a size that’s more akin to a flagship, but we feel that the original Moto X’s size is perfect – as in, it’s more comfortable to hold with one hand. However, we really dig how the 2014 model is sporting a more aggressive and sophisticated design, aided by its aluminum frame and new leather casing options.

5.54 x 2.85 x 0.39 inches
140.8 x 72.4 x 9.9 mm
5.08 oz (144 g)

5.09 x 2.57 x 0.41 inches
129.3 x 65.3 x 10.4 mm
4.59 oz (130 g)

5.54 x 2.85 x 0.39 inches
140.8 x 72.4 x 9.9 mm
5.08 oz (144 g)

5.09 x 2.57 x 0.41 inches
129.3 x 65.3 x 10.4 mm
4.59 oz (130 g)
See the full Motorola Moto X (2014) vs Motorola Moto X size comparison or compare them to other phones using our Size Comparison tool.
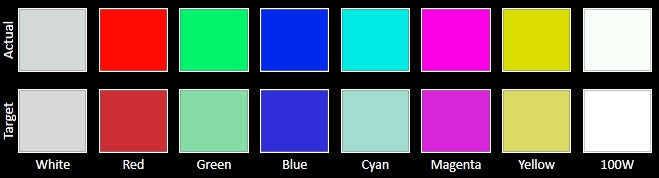
Display
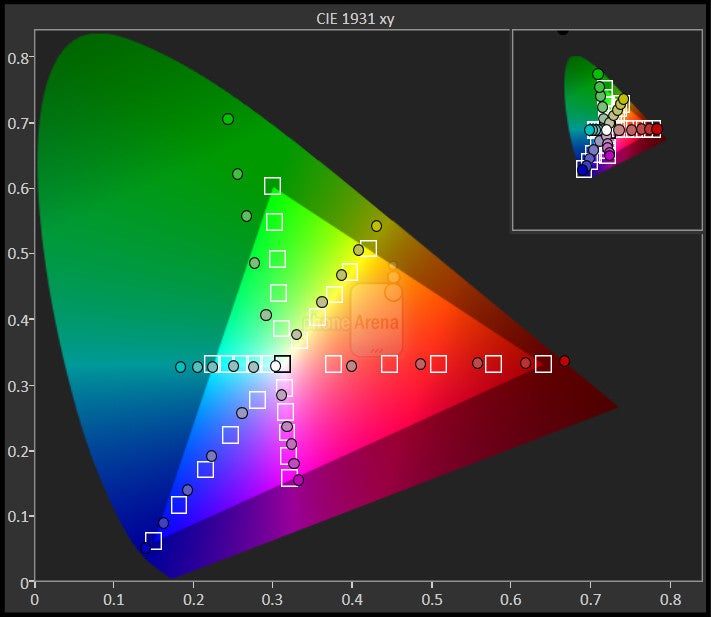
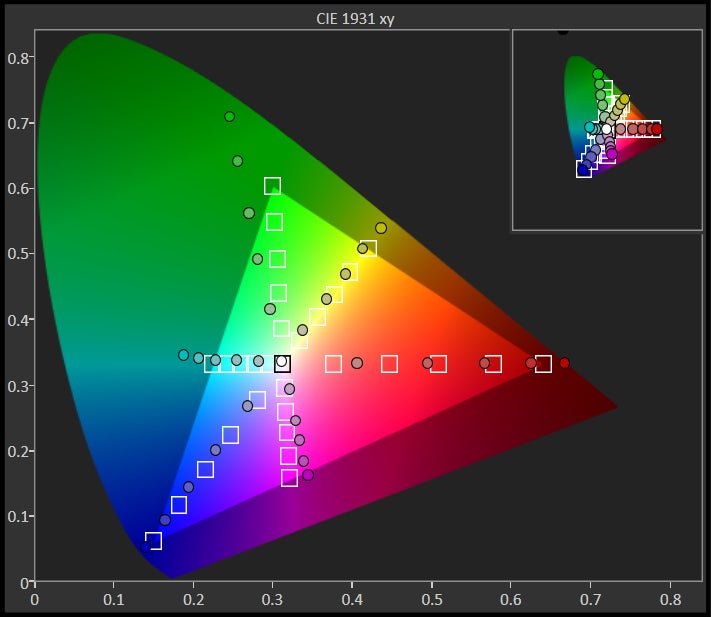
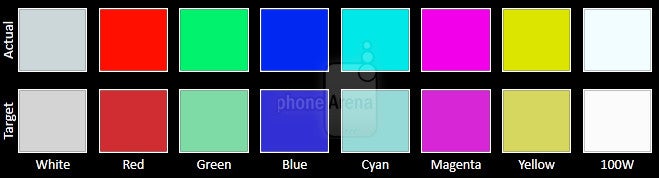
Yet again, the new Moto X reaps the benefits of being more of a flagship phone because of its larger and sharper looking 5.2-inch 1080 x 1920 AMOLED panel – versus the smaller and lower resolution 4.7-inch 720 x 1280 AMOLED display of the original. From a normal distance, it’s almost tough to distinguish which of the two has the upper hand in the details department, but there’s no competition after a closer inspection.


Interface and Functionality
What’s nice between these two smartphones is that they provide us with a very simple, intuitive stock Android experience. Naturally, the superficial visuals don’t differ a whole lot between them, seeing they present us with all of the personalization elements and base features of Android. At the same time, they’ve shown to us that they’ve followed the path of simplicity with its additional software features – as opposed to the “more is better” approach of other customized experiences.
UI of the Motorola Moto X (2014)
The Motorola Moto X (2013)
Frankly, we like what the two have to offer, but being the newer product, the 2014 Moto X sees more enhanced features that slightly eclipses the stuff that last year’s model established. Touchless Control, which is rebranded to Moto Voice, has undergone some changes of its own. The premise, for the most part, remains unchanged with its always-on activation – where reciting the launch phrase gets us access to all of Google Now’s expansive functions. However, the new Moto X adds support to third party apps, like being able to post a status message of Facebook, the option to tell the phone to take a photo/selfie, and your own customized launch phrase.
Moto Assist
Even though we’re obviously leaning towards the new Moto X, the original model’s experience is still pretty good. Heck, it might not have all of the new enhancements, but that doesn’t close the door on it getting them in some future software update down the road. At the moment, however, the new Moto X’s experience is undoubtedly the preferred one.
Processor and Memory
In the specs department, there’s no arguing that the newer model has the better goods – a quad-core 2.5GHz Qualcomm Snapdragon 801 SoC with 2GB of RAM versus the 2-generations older quad-core 1.7GHz Qualcomm Snapdragon S4 Pro processor with 2GB of RAM in last year’s unit. On paper, most people are inclined to favor the newer product, but in all fairness, they produce the same responsive performances with basic operations. Unless you’re playing newer gaming titles, you will hardly notice the difference.
Internet and Connectivity
Separated only by their screen size and resolution, the web browsing experience is for the most part enjoyable with the two. Naturally, the higher resolution of the new Moto X’s display gives text a crisper look, but at the same time, its larger screen is ideal for the function – to lessen our need to kinetic scroll.
Besides the added cellular radio support with the 2014 Moto X, they both pack the same set of connectivity features – such as 4G LTE connectivity, aGPS with Glonass, Bluetooth 4.0, dual-band 802.11 a/b/g/n/ac Wi-Fi, and NFC.
Camera
The camera apps might be identical, in regards to the interface and shooting modes, but the hardware gear in tow between them are different. Last year’s 10-megapixel “Clear Pixel” camera didn’t quite prove as formidable with its quality, so it’s no surprise that Motorola decided to outfit the new model with a slightly heftier 13-megapixel one. So, the question that remains is whether or not it eclipses its predecessor?
Camera interface of the Motorola Moto X (2014)
Camera interface of the Motorola Moto X (2013)
Looking at the overall quality, unless we look meticulously into the shots, most folks would agree that their qualities are identical. However, there are actually subtle improvements to the new phone’s camera that makes it better. For starters, there’s a smidgen more detail with its results. Meanwhile, there’s an apparent warmer color reproduction with the new Moto X’s camera – whereas its predecessor produces colder tones. Essentially, the new Moto X’s photos have a livelier and vibrant quality, in contrast to the subdued and lukewarm look with the older model. Under low light, the new model produces an under-exposed tone with its shots. In comparison, its predecessor’s shots have more details exposed due to its brighter composition.
Sample images
Likewise, the same subtle advantage in overall quality with the new Moto X is also seen in its video recording quality. To be fair, last year’s model still records some spiffy looking 1080p videos, but the newer one has less artifacting elements and just a teeny tiny more details.
Multimedia
Boasting stock Android experiences, there’s no surprise that the two resort to the Google Play Music app as the default music player out of the box. Both armed with single speakers for audio output with music and videos, it’s shocking to find that the old Moto X’s rear firing speaker has a stronger volume output. Still, the audio produced by the new model is more enjoyable, thanks to its richer output.
Videos play nicely on both devices, but the larger and higher resolution display of the new Moto X undoubtedly makes it the more ideal candidate for the experience. It’s not to say that it’s bad with the original handset, but we just simply prefer the qualities of the new model.
The two Moto Xs resort to the Google Play Music app as the default music player
Call Quality
Outdoing itself, Motorola has incorporated 4 microphones into the new Moto X, which as a result, delivers an astounding call quality experience. Previously, last year’s model disappointed us with the distorted voices through the earpiece – so it didn’t necessarily woo us with its quality.
Battery
In contrast to their respective rivals, these two Moto X smartphones were never really long-lasting with their batteries. Instead, they provided us with nothing more than average results. Checking out our battery benchmark test, though, reveals that the 2013 Moto X inches past its successor – a strange occurrence indeed, but considering that the new one houses a larger screen, it kind of makes sense.
Conclusion
Almost everything about the new Moto X is improved over its predecessor, not solely for its specs, but for its overall performance. From call quality, design, and its camera performance, the new Moto X bears all of the incremental improvements to earn the rigid qualities of a true successor. The only thing that most people will face when deciding between the two is their size – where we feel that the old Moto X has the perfect one for comfort and usability.
Follow us on Google News


Things that are NOT allowed:
To help keep our community safe and free from spam, we apply temporary limits to newly created accounts: