LG G3 Vigor Review
Introduction
When a certain flagship smartphone is so unanimously acclaimed by industry folks and consumers alike, it shouldn’t surprise anyone to know that variants of that said handset are bound to arrive. Indeed, that’s exactly what’s happening to the LG G3 here in the US, as the LG G3 Vigor aims to reach a new segment with its low cost through carriers like Sprint and AT&T – while still giving users many of the familiar qualities of its flagship phone in the LG G3. Arguably a mini variant of sorts, can the LG G3 Vigor still attract consumers who have plenty of inexpensive options to choose from?
- microUSB cable
- Wall charger
- Getting to know your phone guide
- Product safety and warranty information user manual
Design
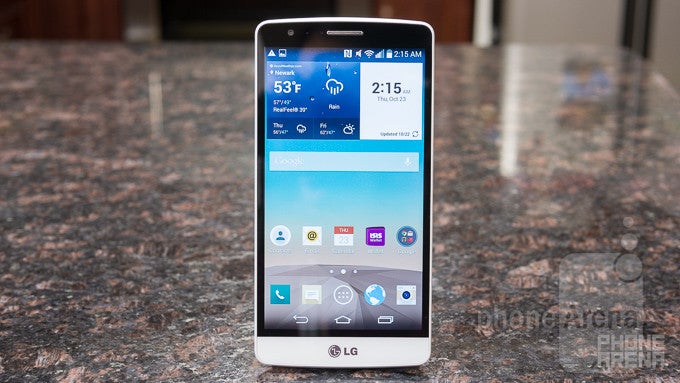
Everything we like about the LG G3’s design is present here, but it’s significantly more compact in size.
Aside from its overall size and weight, the LG G3 Vigor is an exact facsimile of the LG G3 – so it flaunts the same design language as its larger sibling. Still primarily constructed out of plastic, with a thin film of metal incorporated into its rear casing, which gives it that appearance of being brushed metal, the Vigor undoubtedly has a good design balance that comes off nice for an entry-level offering. Better yet, it’s comfortable to hold because of its compact size and the curved nature of its rear casing.
Display
For an entry-level offering, the display actually sports some decent qualities that make it usable.
It’s certainly tough to believe, but it’s become the norm to find entry-level phones sporting 720p displays. Well, that’s exactly what the LG G3 Vigor is rocking – a sizable 5-inch 720 x 1280 IPS LCD display, which produces a pixel density count of 294 ppi. Details are enough to make out find text in the web browser, so it’s not much of a concern when looking at the screen from a normal distance.
Interface and Functionality
Just like its sibling, the Vigor sports LG’s newer, more modern looking interface – and for the most part, it retains several software features of the G3.
LG has done some serious work with its latest user interface, which we find to be vastly superior to previous iterations – mainly due to its use of secondary colors, cleaner looking presentation, and better organization, which all combine together to give it an attractive glow. Running on top of Android 4.4.2 KitKat, it offers most of the same software features present in the G3. For example, we have access to several QSlide apps, the ability to rearrange & customize the homescreen Android buttons, guest mode, one-handed operation, Knock On, Knock Code, and a few gesture functions.
At first glance, it looks like the interface here is uncompromised, but as we dive deeper, we notice that it doesn’t have ALL the same software features of the G3 – it doesn’t offer Dual window and Smart Notice. Well, we’re not terribly upset by those omissions because the phone’s size and performance can only handle so much before cracking under the pressure. Nonetheless, we’re just happy to find the same crisp and modern interface we’ve fallen in love with already.
Processor and Memory
The performance is adequate for light users, but it exhibits delays with heavier operations.
A familiar piece of silicon used by many entry-level smartphones nowadays, the Vigor is powered by a quad-core 1.2GHz Qualcomm Snapdragon 400 SoC coupled with 1GB of RAM and the Adreno 305 GPU. Needless to say, it’s responsive with its performance for the most part, but it doesn’t exhibit the same level of snappiness we get from the G3 – especially when there are delays with simple operations like getting back to the homescreen.
Included with the Vigor is 8GB of internal storage, which might seem small for those big into multimedia consumption, but that figure can be supplemented thanks to its microSD card slot.
Internet and Connectivity
It might not be the most ideal thing for the occasion, but the Vigor at the very least presents us with a manageable web browsing experience thanks to its speedy 4G LTE speeds and moderately responsive navigational controls. Sure, the resolution causes details to appear faint and indistinct at times, but that’s nothing that a few pinch gestures can’t fix.
Domestically, the LG G3 Vigor is sold by AT&T and Sprint, so if you decide to go with the latter, it’ll offer support for Sprint’s CDMA network. Naturally, it also packs 4G LTE, aGPS with Glonass, Bluetooth 4.0, dual-band 802.11 a/b/g/n Wi-Fi, NFC, and a handy IR blaster.
Camera
Stripped of many features, the camera suffers from many undesirable qualities.
Paired with an 8-megapixel rear camera, which is accompanied with an LED flash and the same laser auto focus first introduced by the G3, we have some not so shabby tech in the Vigor. However, unlike the G3, it doesn’t get treated to any meaningful secondary shooting modes and manual controls. Rather, the only options we have available are panoramic and HDR modes.
The same qualities hinder its 1080p video recording as well. It’s not terrible, but it’s certainly not something we’re incline to use for those moments that matter to us. Again, it’s very light on details, but it’s frustrating that it has a very sensitive exposure adjustment – plus, its slow continuous auto focus is a pain to deal with.

Multimedia
You can’t knock it for having the same rich and engaging multimedia experience as the G3.
Bearing the updated LG interface, the music player also benefits from having a cleaner, more visually alluring presentation – giving it a modern and organized experience. Emitting sound through the single speaker in the rear of the phone, it somehow manages to muster up an amazing 79.1 dB of audio power, which eclipses many flagship phones. Despite its powerful output, its quality sounds a little bit hollow.
To tell you the truth, we can’t complain about the video watching experience, since it offers decent support for various codecs. Thanks to the large size of its screen, as well as some of its pleasing qualities, it’s a presentable thing for the occasion – albeit, the multi-tasking aspect of the video player causes its performance to diminish.
Call Quality
A strong earpiece, combined with good audio quality, makes the Vigor a delightful treat for phone calls.
In our experience, the Vigor is a delightful thing to use for phone calls because of the clear and noise-free voices we hear through its earpiece, which is pretty loud in tone. However, its speakerphone quality favors a sharper tone. Meanwhile, our callers, too, didn’t have any issues on their end, as they’re able to comprehend us properly.
Battery
You’ll power through an 8-hour shift with no issues, but its battery life is nothing more than average at the end of the day.
Attached with a 2540 mAh battery, which is marginally larger than some other similarly spec’d entry-level phones, the Vigor delivers average results with its battery life. It’s still something that requires nightly charges, but it’s enough to get people through an 8-hour work shift. In our battery benchmark test, it musters up a mark of 6 hours and 35 minutes, which is a respectable figure.
Conclusion
Between the two carriers selling the LG G3 Vigor stateside, Sprint is the one selling it for less – $29.99 on-contract or $312 outright. That certainly is better than AT&T’s asking price of $49.99 on-contract, or $334.99 outright. Looking at its on-contract prices, it’s not a bad option. For the most part, its specs are reduced compared to the original G3 to reflect its entry-level status, but it’s relieving to know that several features have been retained – like its IR blaster, the microSD card slot, and several software enhancements.
Not surprisingly, it’s an inexpensive option that for the most part delivers an inviting experience. However, if we’re to look at its outright pricing, it’s hard to vouch for the phone knowing that the comparable Moto G (2014) is sporting a hard-to-beat outright cost of $179.99. Stick with the Vigor if you plan on being with your carrier long term, but if not, the Moto G (2014) is still the option to pick up.
Software version of the review unit:
Android Version: 4.4.2
Baseband Version: MPSS.Di.2.0.1.c1.15-00013-M8926DAAAANAZM-1
Kernel Version: 3.4.0+

Follow us on Google News








Things that are NOT allowed:
To help keep our community safe and free from spam, we apply temporary limits to newly created accounts: