Samsung Galaxy A7 (2016 edition) display and CPU performance benchmark test results: mid-range to the bone

posted by Victor H.
Jan 29, 2016, 10:25 AM

Today, we take a look at the benchmarks to understand the Galaxy A7 (2016) better. First, let's take a look at the CPU and GPU performance benchmark tests and their results on the new A7.
And there, the Galaxy A7 (2016) ranks sub-par.
Benchmarking the Snapdragon 615-power Galaxy A7 (2016)
Our model uses the Snapdragon 615 (MSM 8939) octa-core system chip with four Cortex A53 cores running at up to 1.5GHz and four more, battery-savvy A53s clocked to run at up to 1.2GHz. The chip is made on the 28nm manufacturing node (top-end phones like the Galaxy S6 have their chips made on more power efficient nodes, like the 16nm FinFET). There is 3GB of RAM on board, 16GB of internal storage and a hybrid dual SIM card slot (supporting either two nano SIM slots or a nano SIM and microSD card slot).
Keep in mind that in some markets, the phone is said to ship with the Samsung Exynos 7580 octa-core system chip and performance might differ slightly (but not by much).
CPU performance is below that of even the $200 honor 5X and it falls behind mid-range phones like the OnePlus X and HTC One A9.
AnTuTu Higher is better
|
Samsung Galaxy A7 (2016)
34395.33
Samsung Galaxy A5 (2016)
35638.33
Samsung Galaxy Note5
67207
LG V10
46905.33
HTC One A9
40632
Motorola Moto X Pure Edition (2015)
51822
Apple iPhone 6s
59075
LG G4
50330
Honor 5X
35183
OnePlus X
40173
Sony Xperia Z5
51012.33
Motorola DROID Turbo 2
52201
|
Geekbench 3 single-core Higher is better
|
Samsung Galaxy A7 (2016)
676.3
Samsung Galaxy A5 (2016)
684.33
Samsung Galaxy Note5
1431
LG V10
870
HTC One A9
738
Motorola Moto X Pure Edition (2015)
650
Apple iPhone 6s
2539
LG G4
1112
Honor 5X
696
OnePlus X
910.33
Sony Xperia Z5
1318.6
Motorola DROID Turbo 2
1043
|
Geekbench 3 multi-core Higher is better
|
Samsung Galaxy A7 (2016)
3013
Samsung Galaxy A5 (2016)
3023
Samsung Galaxy Note5
4717
LG V10
3361.33
HTC One A9
3063
Motorola Moto X Pure Edition (2015)
2075
Apple iPhone 6s
4421
LG G4
3559
Honor 5X
3028
OnePlus X
2415.33
Sony Xperia Z5
4167.3
Motorola DROID Turbo 2
4194
|
Vellamo Metal Higher is better
|
Samsung Galaxy A7 (2016)
1094.66
Samsung Galaxy A5 (2016)
1115
Samsung Galaxy Note5
2532
LG V10
2216
HTC One A9
1078
Motorola Moto X Pure Edition (2015)
2657
LG G4
2369
Honor 5X
1108
OnePlus X
1542
Sony Xperia Z5
1667.33
Motorola DROID Turbo 2
2124
|
Vellamo Browser Higher is better
|
Samsung Galaxy A7 (2016)
1982
Samsung Galaxy A5 (2016)
1944
Samsung Galaxy Note5
5476
LG V10
3571.33
HTC One A9
2331
Motorola Moto X Pure Edition (2015)
4424
LG G4
3948
Honor 5X
2327
OnePlus X
2661
Sony Xperia Z5
4301.66
Motorola DROID Turbo 2
3714
|
Sunspider Lower is better
|
Samsung Galaxy A7 (2016)
1941.6
Samsung Galaxy A5 (2016)
1961.86
Samsung Galaxy Note5
677.7
LG V10
1047.16
HTC One A9
1712
Motorola Moto X Pure Edition (2015)
1529.1
Apple iPhone 6s
217.7
LG G4
730.2
Honor 5X
1171.7
OnePlus X
1285.5
Sony Xperia Z5
675.3
Motorola DROID Turbo 2
867.2
|
GFXBench T-Rex HD on-screen Higher is better
|
Samsung Galaxy A7 (2016)
14
Samsung Galaxy A5 (2016)
14
Samsung Galaxy Note5
37
LG V10
25
HTC One A9
16
Motorola Moto X Pure Edition (2015)
24
Apple iPhone 6s
59.1
LG G4
25
Honor 5X
15
OnePlus X
23
Sony Xperia Z5
53
Motorola DROID Turbo 2
16
|
GFXBench Manhattan 3.1 on-screen Higher is better
|
Samsung Galaxy A7 (2016)
5.76
Samsung Galaxy A5 (2016)
5.6
Samsung Galaxy Note5
15
LG V10
5.7
HTC One A9
6.6
Motorola Moto X Pure Edition (2015)
9.3
Apple iPhone 6s
56.1
LG G4
9.4
Honor 5X
6
OnePlus X
10
Sony Xperia Z5
18.3
Motorola DROID Turbo 2
40
|
Basemark OS II Higher is better
|
Samsung Galaxy A7 (2016)
827.66
Samsung Galaxy A5 (2016)
763.33
Samsung Galaxy Note5
1765
LG V10
1148.33
HTC One A9
957
Motorola Moto X Pure Edition (2015)
1214
Apple iPhone 6s
2139
LG G4
1549
OnePlus X
1185.66
Sony Xperia Z5
1575
Motorola DROID Turbo 2
1426
|
In graphics tests, the Galaxy A7 (2016) uses its Adreno 405 GPU. The results are again rather mediocre and if you are playing more intense games, the phone might drop some frames and might not be perfect for gamers.
Galaxy A7 (2016)'s Super AMOLED put to the test
After testing the system chip, it's time to take a look at the quality of the display.
We have a 5.5-inch Super AMOLED display on the Galaxy A7 (2016) with a resolution of 1080 x 1920 pixels. This is sufficiently sharp for everyone, but pixel maniacs and it's hard to notice any pixelization.
All Samsung phones with AMOLED screens have different color modes that you can change from Settings -> Display -> Screen mode. The default Adaptive mode is very saturated and changes depending on the content, then you have AMOLED Cinema and AMOLED Photo that also are traditionally more saturated than the Internet's de facto accepted sRGB color standard.
Put simply, if you want to see colors the way photographs and video creators have tried to capture them, your display has to be calibrated to that sRGB standard. For the Galaxy A7 (2016) the 'Basic' screen mode is closest to that. And it's overall a good looking screen when you use that mode. Brighntess is enough for most occasions (but you might have some trouble reading the screen in direct sunlight) and at night it can drop to just 1 nit, which is easy on the eyes. Typically for AMOLED, blacks are real, pitch black which creates nice contrast to displayed images.
Take a look at our full display measurements for the Galaxy A7 (2016) right below.
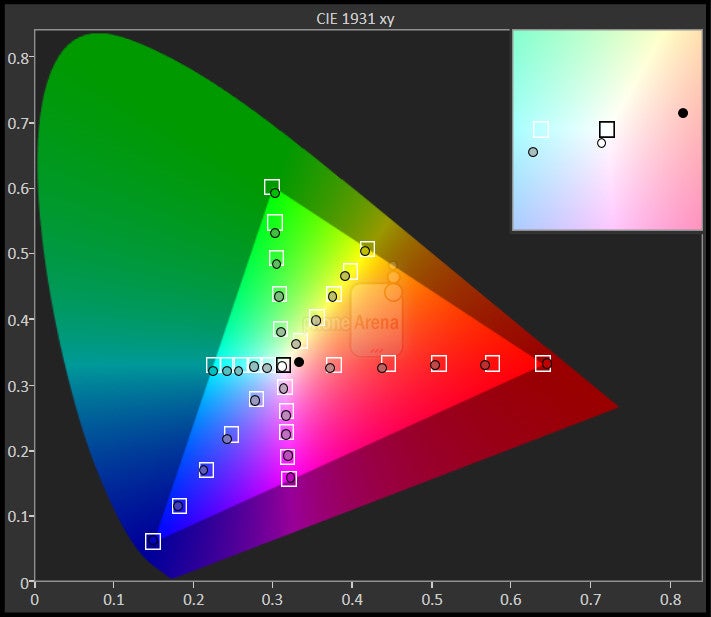
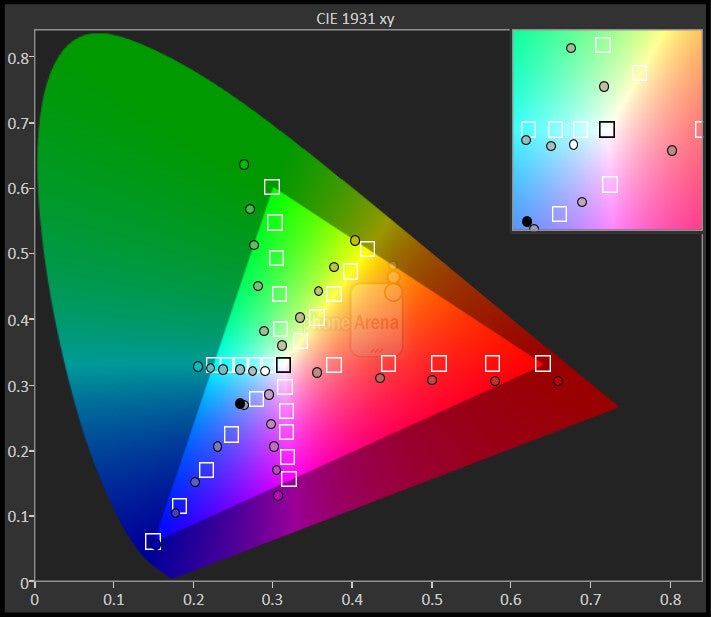
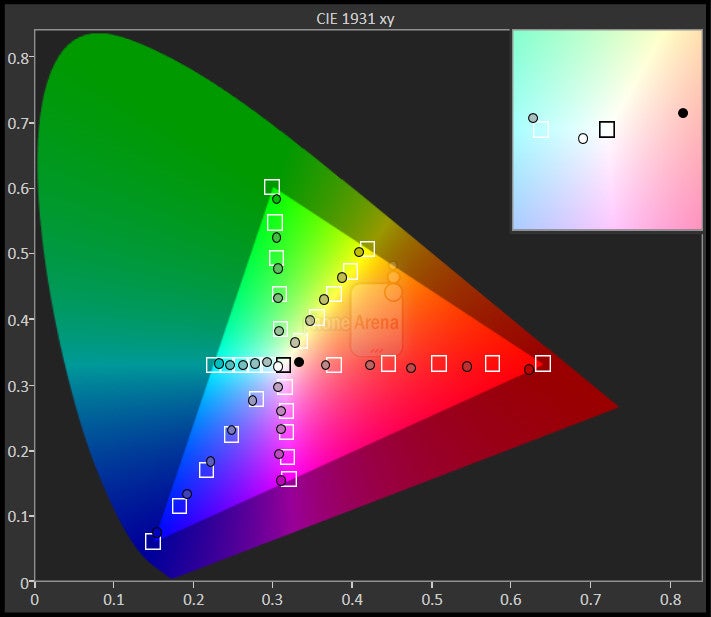
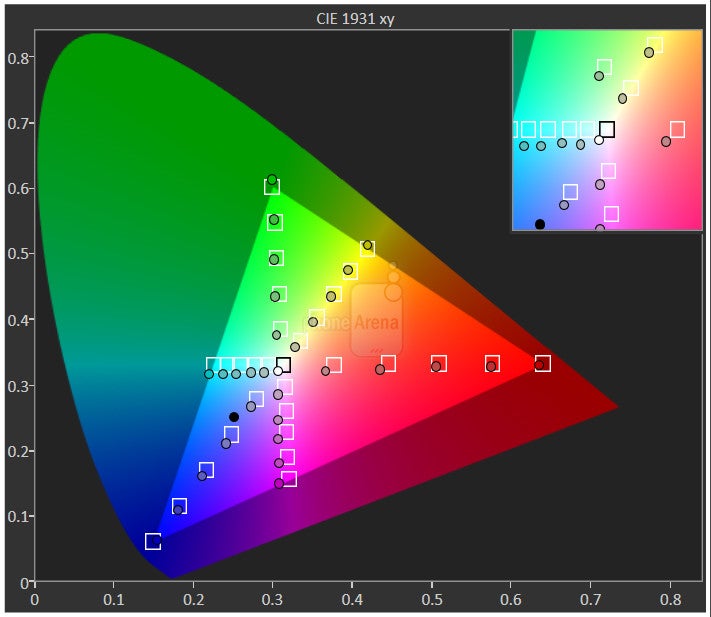
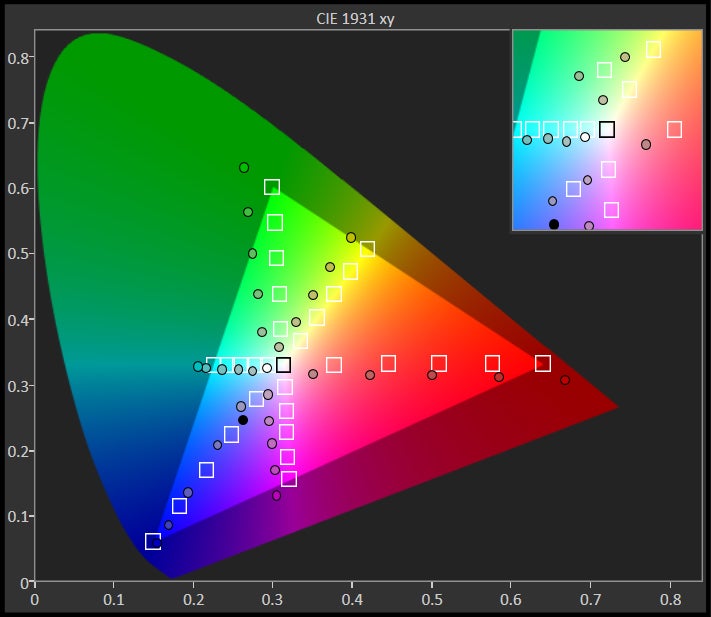
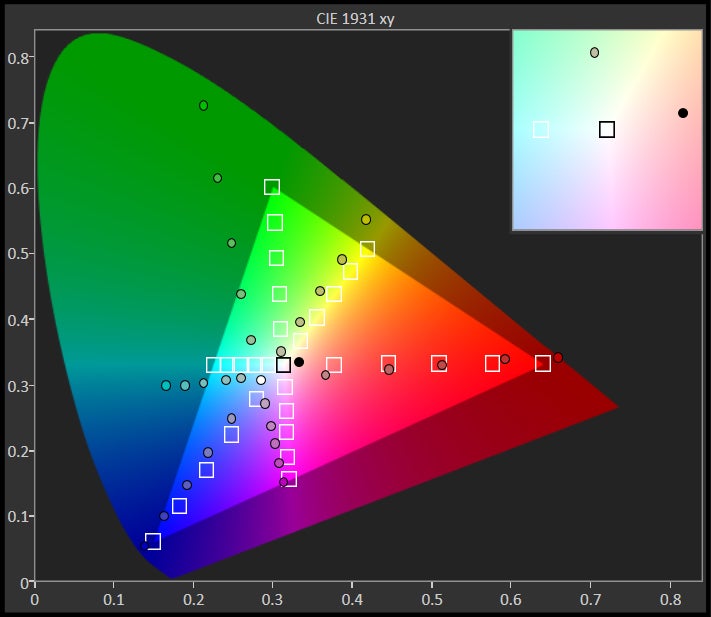
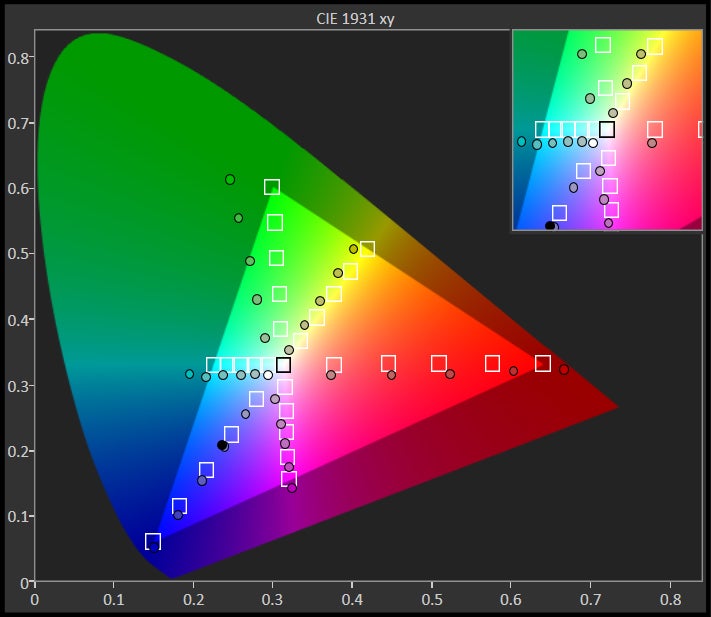
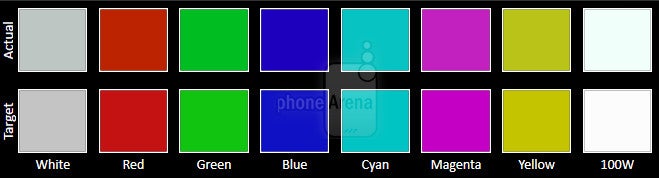
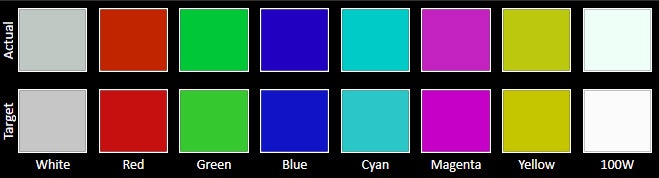
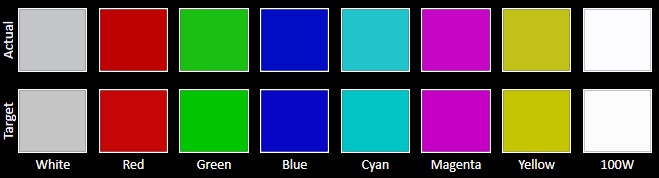
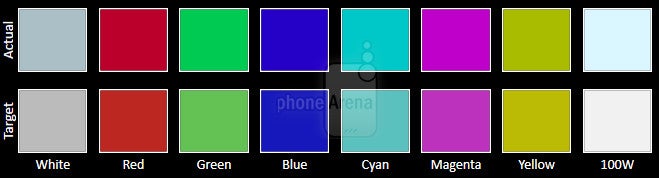
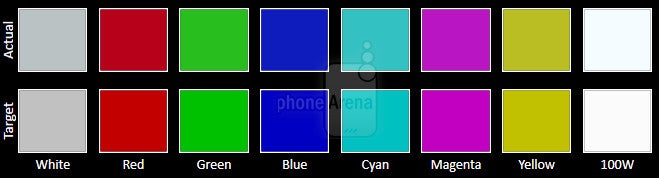
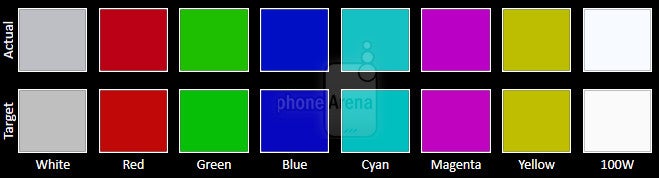
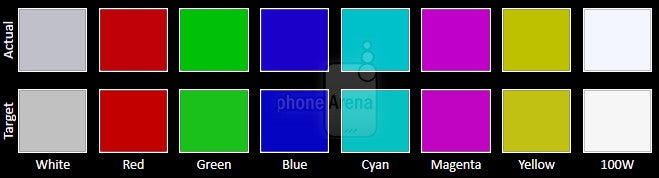
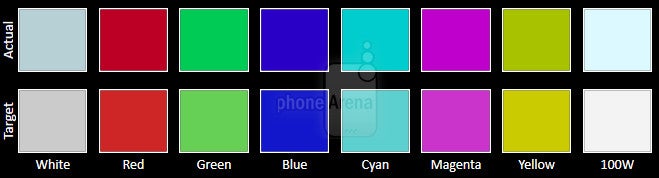
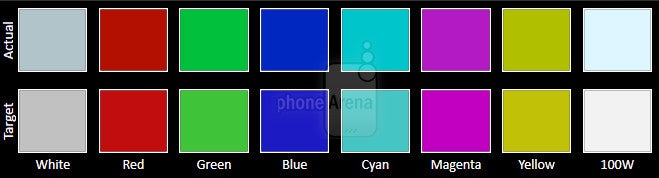
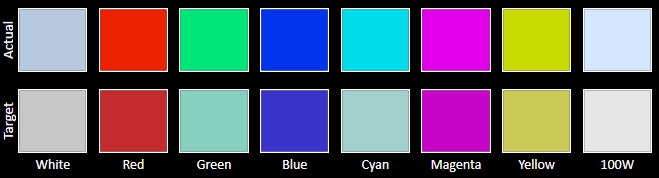
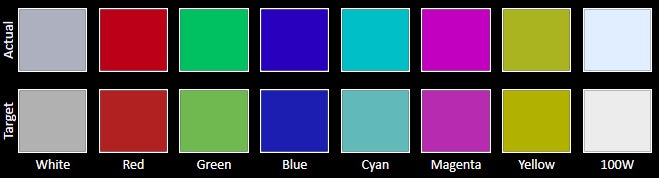
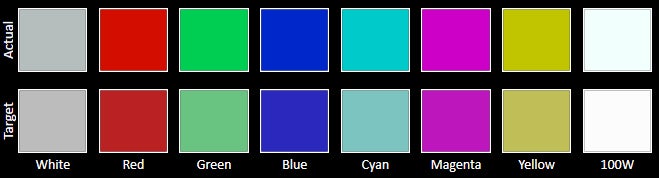
Samsung Galaxy A7 (2016) display quality measurements
The CIE 1931 xy color gamut chart represents the set (area) of colors that a display can reproduce, with the sRGB colorspace (the highlighted triangle) serving as reference. The chart also provides a visual representation of a display's color accuracy. The small squares across the boundaries of the triangle are the reference points for the various colors, while the small dots are the actual measurements. Ideally, each dot should be positioned on top of its respective square. The 'x: CIE31' and 'y: CIE31' values in the table below the chart indicate the position of each measurement on the chart. 'Y' shows the luminance (in nits) of each measured color, while 'Target Y' is the desired luminance level for that color. Finally, 'ΔE 2000' is the Delta E value of the measured color. Delta E values of below 2 are ideal.
These measurements are made using Portrait Displays' CalMAN calibration software.
The Color accuracy chart gives an idea of how close a display's measured colors are to their referential values. The first line holds the measured (actual) colors, while the second line holds the reference (target) colors. The closer the actual colors are to the target ones, the better.
These measurements are made using Portrait Displays' CalMAN calibration software.
The Grayscale accuracy chart shows whether a display has a correct white balance (balance between red, green and blue) across different levels of grey (from dark to bright). The closer the Actual colors are to the Target ones, the better.
These measurements are made using Portrait Displays' CalMAN calibration software.
Maximum brightness Higher is better | Minimum brightness (nits) Lower is better | Contrast Higher is better | Color temperature (Kelvins) | Gamma | Delta E rgbcmy Lower is better | Delta E grayscale Lower is better | |
---|---|---|---|---|---|---|---|
Samsung Galaxy A7 (2016) |
369 (Average) |
1 (Excellent) |
unmeasurable (Excellent) |
6731 (Excellent) |
2.12 |
2.26 (Good) |
3.69 (Good) |
Samsung Galaxy A5 (2016) |
479 (Good) |
1 (Excellent) |
unmeasurable (Excellent) |
6610 (Excellent) |
2.04 |
2.52 (Good) |
5.26 (Average) |
Samsung Galaxy Note5 |
470 (Good) |
2 (Excellent) |
unmeasurable (Excellent) |
6722 (Excellent) |
2.09 |
1.32 (Excellent) |
1.94 (Excellent) |
LG V10 |
457 (Good) |
4 (Excellent) |
1:1556 (Excellent) |
7877 (Average) |
2.35 |
4.06 (Average) |
6.57 (Average) |
HTC One A9 |
345 (Average) |
11 (Average) |
unmeasurable (Excellent) |
6829 (Excellent) |
2.1 |
2.42 (Good) |
3.01 (Good) |
Motorola Moto X Pure Edition (2015) |
715 (Excellent) |
1 (Excellent) |
1:1072 (Good) |
6748 (Excellent) |
2.19 |
1.22 (Excellent) |
1.81 (Excellent) |
Apple iPhone 6s |
554 (Excellent) |
6 (Good) |
1:1593 (Excellent) |
7056 (Good) |
2.21 |
1.47 (Excellent) |
3.23 (Good) |
LG G4 |
454 (Good) |
2 (Excellent) |
1:1930 (Excellent) |
8031 (Poor) |
2.24 |
4.36 (Average) |
7.28 (Average) |
Honor 5X |
585 (Excellent) |
7 (Good) |
1:1251 (Excellent) |
8021 (Poor) |
2.19 |
2.9 (Good) |
6.77 (Average) |
OnePlus X |
298 (Poor) |
1 (Excellent) |
unmeasurable (Excellent) |
8816 (Poor) |
2 |
7.9 (Average) |
8.12 (Poor) |
Sony Xperia Z5 |
672 (Excellent) |
4 (Excellent) |
1:1256 (Excellent) |
7688 (Average) |
2.62 |
3.79 (Good) |
6.19 (Average) |
Motorola DROID Turbo 2 |
445 (Good) |
2 (Excellent) |
unmeasurable (Excellent) |
6849 (Excellent) |
2.34 |
4.81 (Average) |
4.38 (Average) |
The numbers below represent the amount of deviation in the respective property, observed when a display is viewed from a 45-degree angle as opposed to direct viewing.
Maximum brightness Lower is better | Minimum brightness Lower is better | Contrast Lower is better | Color temperature Lower is better | Gamma Lower is better | Delta E rgbcmy Lower is better | Delta E grayscale Lower is better | |
---|---|---|---|---|---|---|---|
HTC One A9 |
48.4% |
45.5% |
unmeasurable |
12.9% |
1% |
44.6% |
110% |
Motorola DROID Turbo 2 |
52.4% |
50% |
unmeasurable |
13.3% |
1.3% |
45.5% |
66.4% |
Samsung Galaxy Note5 |
60.4% |
50% |
unmeasurable |
5.7% |
2.4% |
281.1% |
128.9% |
Samsung Galaxy A7 (2016) |
65.3% |
0% |
unmeasurable |
3.1% |
1.4% |
139.8% |
179.1% |
OnePlus X |
66.4% |
0% |
unmeasurable |
35.2% |
0% |
37.8% |
60.8% |
Samsung Galaxy A5 (2016) |
67.4% |
0% |
unmeasurable |
1% |
2.5% |
114.3% |
103.6% |
Apple iPhone 6s |
82.9% |
83.3% |
79.8% |
5.1% |
10.9% |
56.5% |
53.9% |
Sony Xperia Z5 |
83.9% |
75% |
82.1% |
17.7% |
1.1% |
2.6% |
28.4% |
Motorola Moto X Pure Edition (2015) |
85.7% |
0% |
79% |
12.3% |
3.2% |
73.8% |
185.6% |
Honor 5X |
86.3% |
85.7% |
84.2% |
6.6% |
0.5% |
12.4% |
4.3% |
LG G4 |
86.8% |
50% |
90.3% |
5.4% |
0.9% |
7.3% |
28.6% |
LG V10 |
88% |
75% |
90.6% |
3.2% |
14.5% |
3.9% |
3.5% |
Finally, stay tuned for our full Samsung Galaxy A7 (2016) review coming up next week. There, we will give you our final conclusion about the phone and how good it really is.
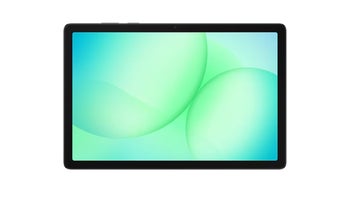
SUBSCRIBE TO OUR NEWSLETTER!