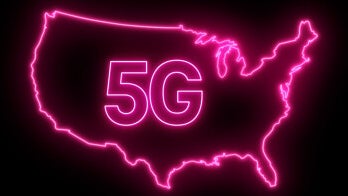
Although the current state of the US wireless industry is... complicated and constantly shifting, especially when talking specifically about 5G networks, most mobile analytics firms seem to agree that T-Mobile has the edge on Verizon and AT&T in terms of nationwide speeds and blazing fast service availability.
But while RootMetrics, Ookla, and Opensignal like to regularly keep track of the carriers' progress and compare the "big three" in different aspects of the overall user experience, the latter company is doing something a little less common today, evaluating states and cities rather than mobile network operators according to several 5G-related criteria.
Have you ever wondered if New York's average 5G download speeds are higher or lower than those registered by Texas residents (regardless of their provider of choice)? Are you curious to see where Chicago ranks in 5G availability when compared with Los Angeles or Miami? Do you live in Houston and want to brag about your insanely fast mobile connection to a friend in Salinas, California? This comprehensive new Opensignal report is exactly what you've been looking for, following up on a similar research paper published in September 2021.
What are the fastest and slowest US states right now?
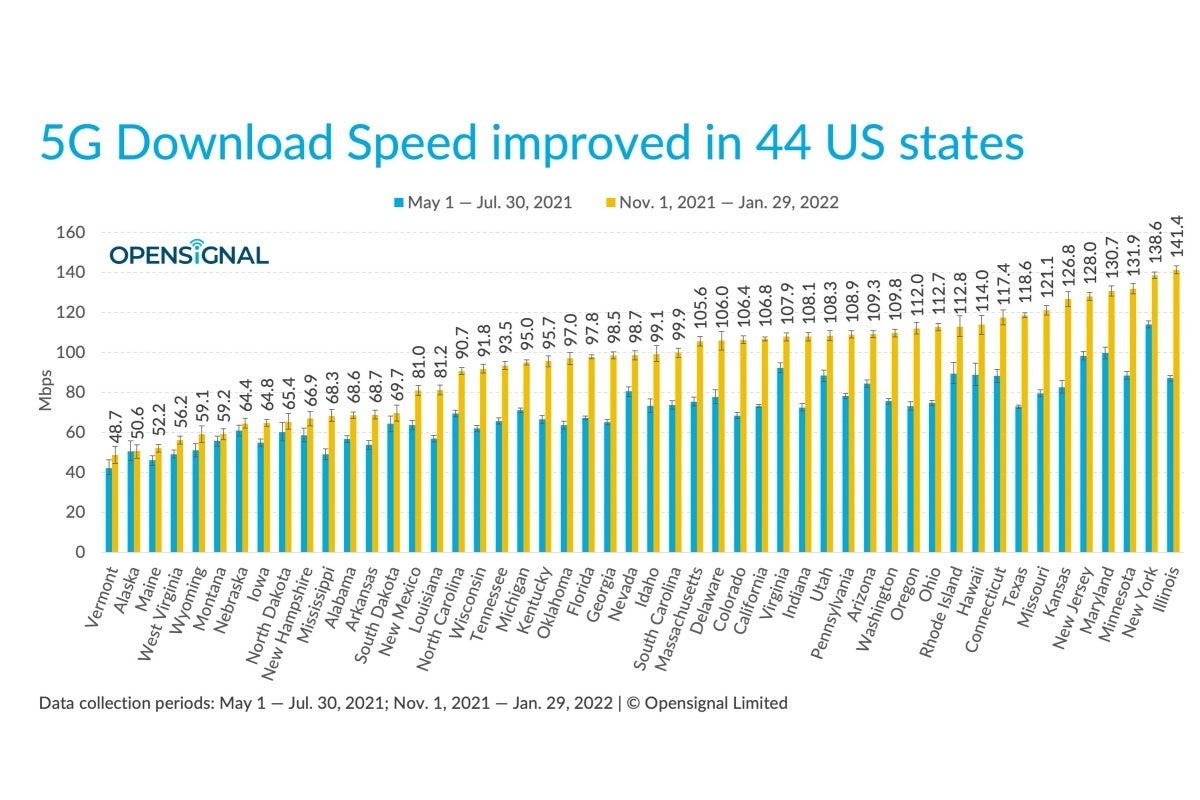
You might think that six months wouldn't make a world of difference for US 5G download speeds, especially with these new tests concluding just a few days after Verizon started deploying its potentially game-changing C-band spectrum, but somehow, the figures recorded in 44 states managed to jump by more than a third on average.
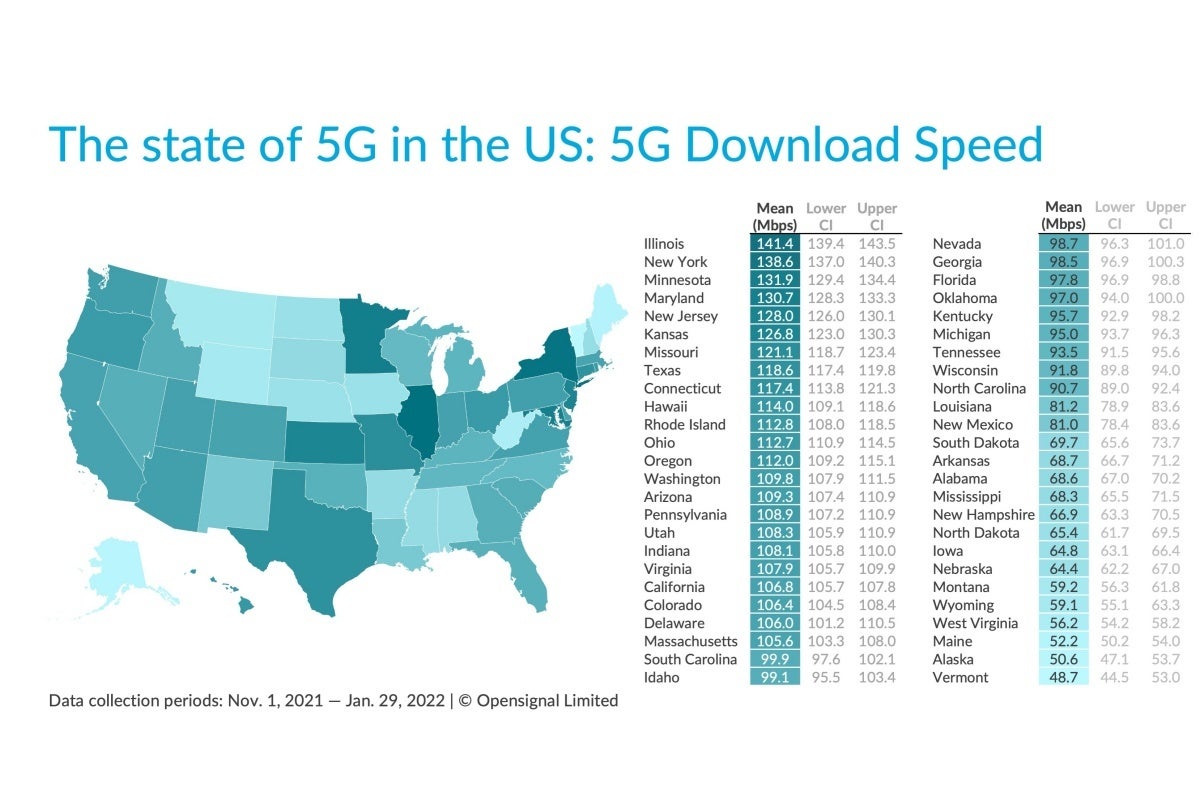
That's a general improvement of 27 Mbps, led by the great state of Illinois, which boosted its average 5G download speed by an incredible 54.2 Mbps, to a towering 141.4 Mbps. Due to a healthy progress of its own that was however far less awe-inspiring, New York slipped from first to second place, narrowly edging out Minnesota, which previously ranked eight.
Recommended For You
A number of other states climbed up the chart thanks to above-average speed gains, including Kansas, Missouri, Texas, Ohio, Oregon, Washington, Indiana, and Colorado, while South Dakota, North Dakota, Nebraska, Montana, and Alaska stayed near the bottom of the table after failing to "statistically" improve their 5G download scores. In last place, Vermont didn't do much to step up its 5G speed game either, and the same goes for Hagerstown-Martinsburg, Maryland.
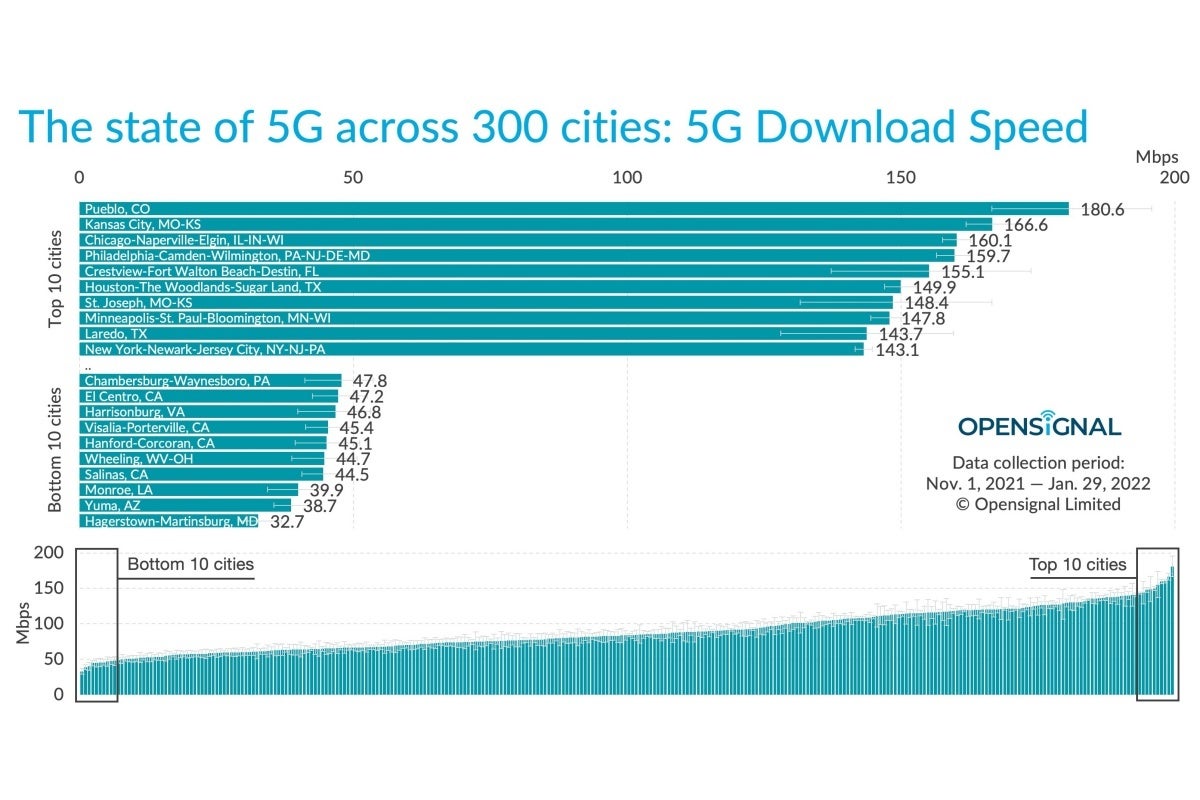
With a population of around 260,000 people, the latter metropolitan area is once again ranked at the very bottom of Opensignal's 5G speed chart as far as major US cities are concerned. This time, the analytics company included 300 cities instead of just 250 in its report, which might explain why we have a new leader in Pueblo, Colorado.
Then again, we're pretty sure Kansas City and Chicago, which are the new silver and bronze medalists respectively, were evaluated last time around as well. Former leader Laredo, Texas has fallen down to ninth place, mind you, with Salt Lake City no longer ranked in the top ten and NYC down no less than seven spots despite gaining a solid 25 Mbps or so. If that doesn't show general industry progress, we don't know what does.
Where can you find the most easily accessible 5G?
To answer that question, you could of course consult T-Mobile, AT&T and Verizon's (notoriously inaccurate) coverage maps. But even if you're lucky enough to live in a place where 5G is actually available (on occasion), said maps will never reflect the real-world availability of the carriers' latest and greatest cellular signals.
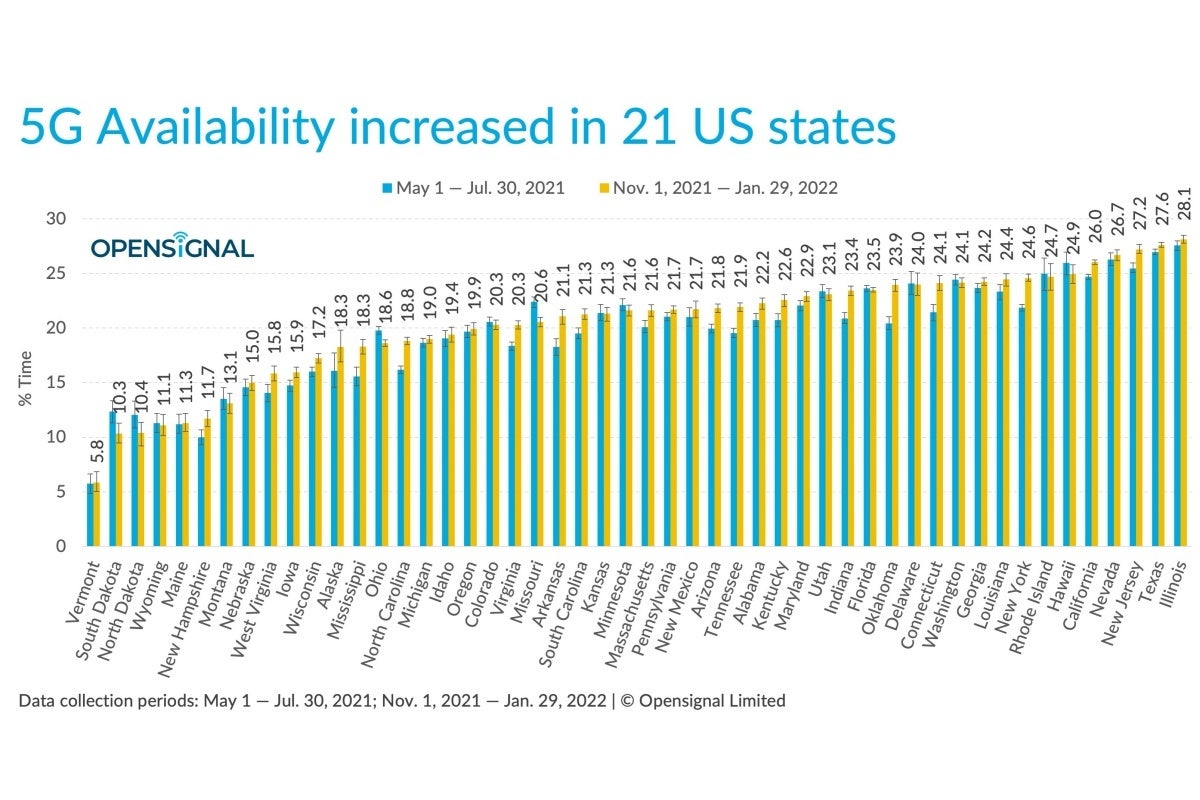
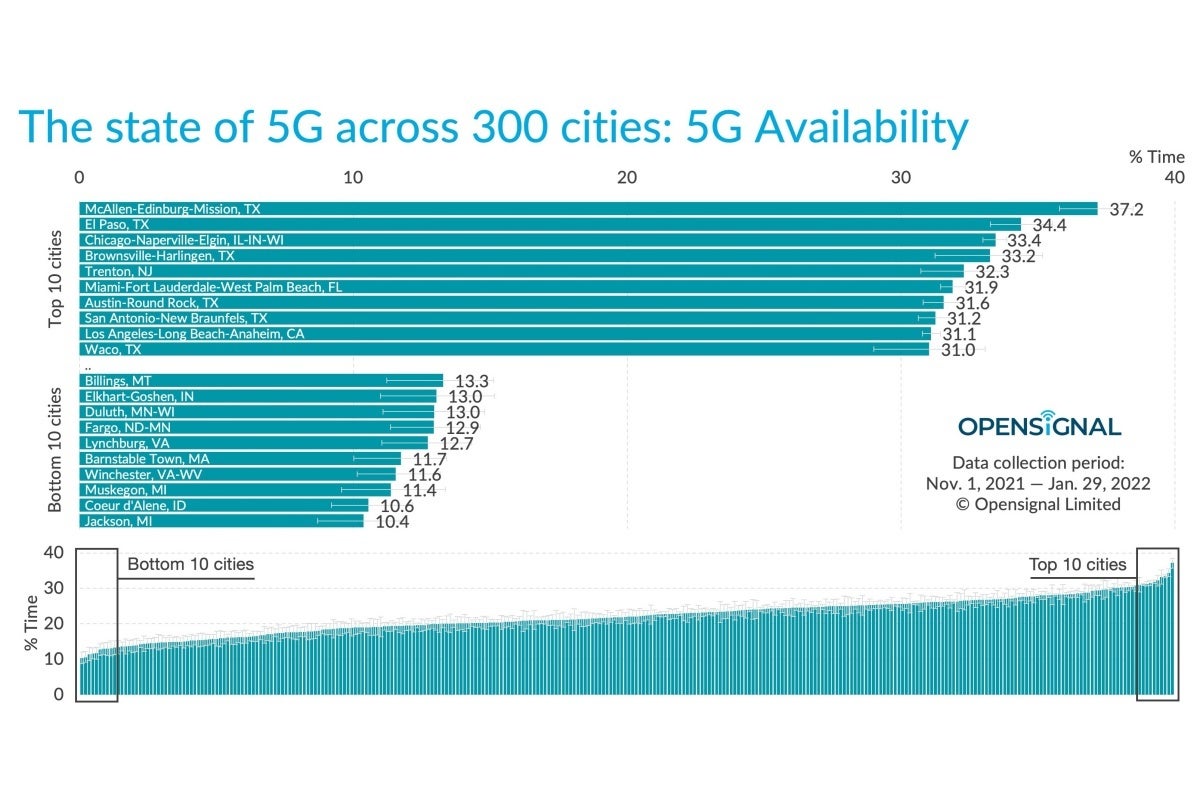
5G availability is defined for the purposes of this report as the "proportion of time" that 5G users can see an active 5G connection on their smartphones, with this particular measure of the overall network experience improved in just 21 states compared to September 2021, including new (and old) category joint leaders Illinois and Texas.
The two states are closely followed by New Jersey, Nevada, and California, but we have to point out even the chart-topping scores here are pretty disappointing, at around 28 percent. That basically means 5G users still spend a vast majority of their time connected to "outdated" 4G LTE technology across the nation, which is simply unacceptable in a market where all three top dogs claim to offer "nationwide" 5G service.
For what it's worth, a number of big cities have managed to break the 30 percent 5G availability barrier, most of which are located in Texas for some reason, while a few others still sit barely above the 10 percent mark.
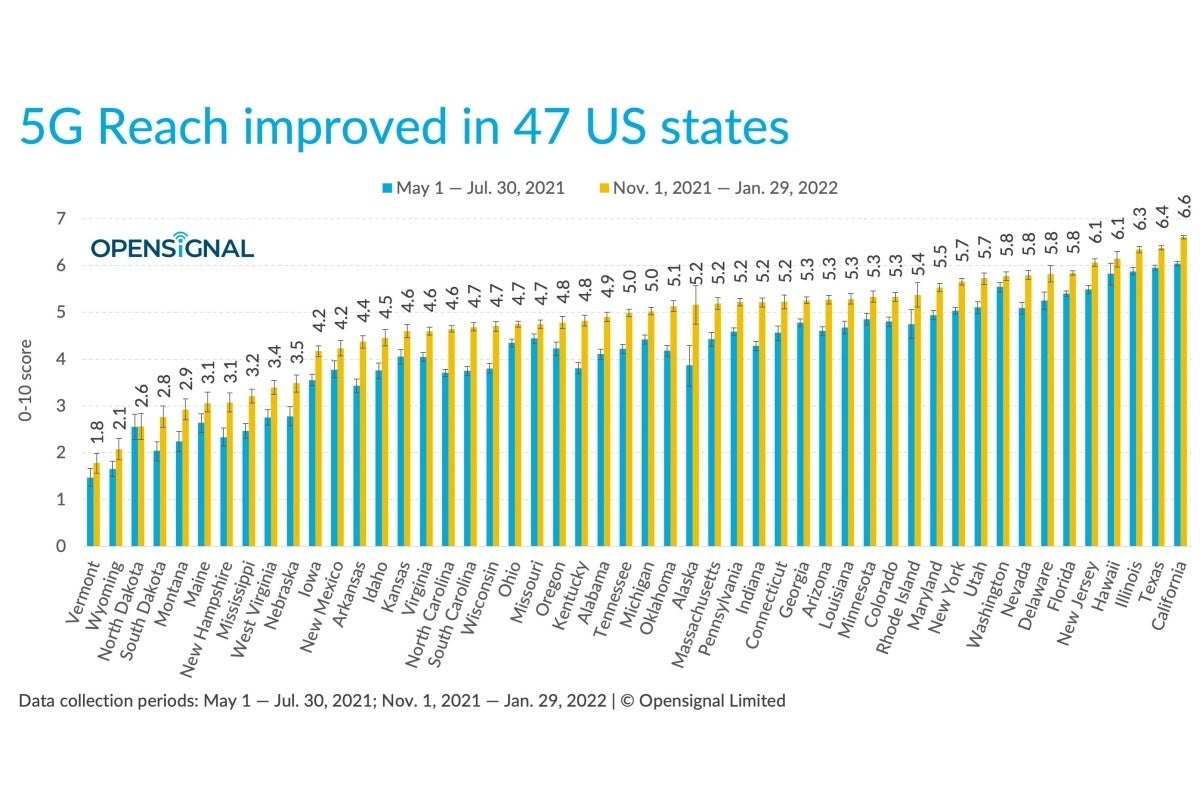
5G reach is another factor to take into consideration for those thinking of relocating, with California, Texas, and Illinois reigning supreme among the nation's 50 states as far as the "proportion of locations" where 5G users can typically get 5G service is concerned and Vermont claiming yet another wooden spoon. Vermont also happens to be one of just three states that failed to boost its score in this category these last six months.
Get Visible as low as $20/mo for 1 year. Limited time offer with code: FRESHSTART
$20
/mo
$25
$5 off (20%)
Offer Ends 6.1.2026 at 11.59pm ET. New members get $5/mo off the $25/mg Visible plan, $35/mo Visible+ plan, or $45/mo Visible+ Pro plan for the first 12 months. Promo code FRESHSTART required at checkout.
Adrian, a mobile technology enthusiast since the Nokia 3310 era, has been a dynamic presence in the tech journalism field, contributing to Android Authority, Digital Trends, and Pocketnow before joining PhoneArena in 2018. His expertise spans across various platforms, with a particular fondness for the diversity of the Android ecosystem. Despite the challenges of balancing full-time parenthood with his work, Adrian's passion for tech trends, running, and movies keeps him energized. His commitment to mid-range smartphones has led to an eclectic collection of devices, saved from personal bankruptcy by his preference for 'adequate' over 'overpriced'.
A discussion is a place, where people can voice their opinion, no matter if it
is positive, neutral or negative. However, when posting, one must stay true to the topic, and not just share some
random thoughts, which are not directly related to the matter.
Things that are NOT allowed:
Off-topic talk - you must stick to the subject of discussion
Offensive, hate speech - if you want to say something, say it politely
Spam/Advertisements - these posts are deleted
Multiple accounts - one person can have only one account
Impersonations and offensive nicknames - these accounts get banned
To help keep our community safe and free from spam, we apply temporary limits to newly created accounts:
New accounts created within the last 24 hours may experience restrictions on how frequently they can
post or comment.
These limits are in place as a precaution and will automatically lift.
Moderation is done by humans. We try to be as objective as possible and moderate with zero bias. If you think a
post should be moderated - please, report it.
Have a question about the rules or why you have been moderated/limited/banned? Please,
contact us.


Things that are NOT allowed:
To help keep our community safe and free from spam, we apply temporary limits to newly created accounts: