Every product we review or recommend is thoroughly tested by our in-house experts in real-world conditions, following our
review methodology
and
ethics statement
to ensure honest, independent, and data-driven results.
Introduction:
Samsung's lower midrange champion, the Galaxy Ace line, got a third generation entrant this year with the aptly named Galaxy Ace 3. It is not a huge upgrade over its predecessor, however, as is the habit with Samsung's annual updates, and the phone mainly got a 0.2" screen bump and a tad faster processor.
Another ace up its sleeve, pun not intended, is that the Ace 3 runs the newest Android 4.2 and is splattered with the newest TouchWiz Nature UX interface from Samsung. Is this enough to warrant your upgrade, or make you choose it before the sea of Android midrangers out there? Read on to find out...
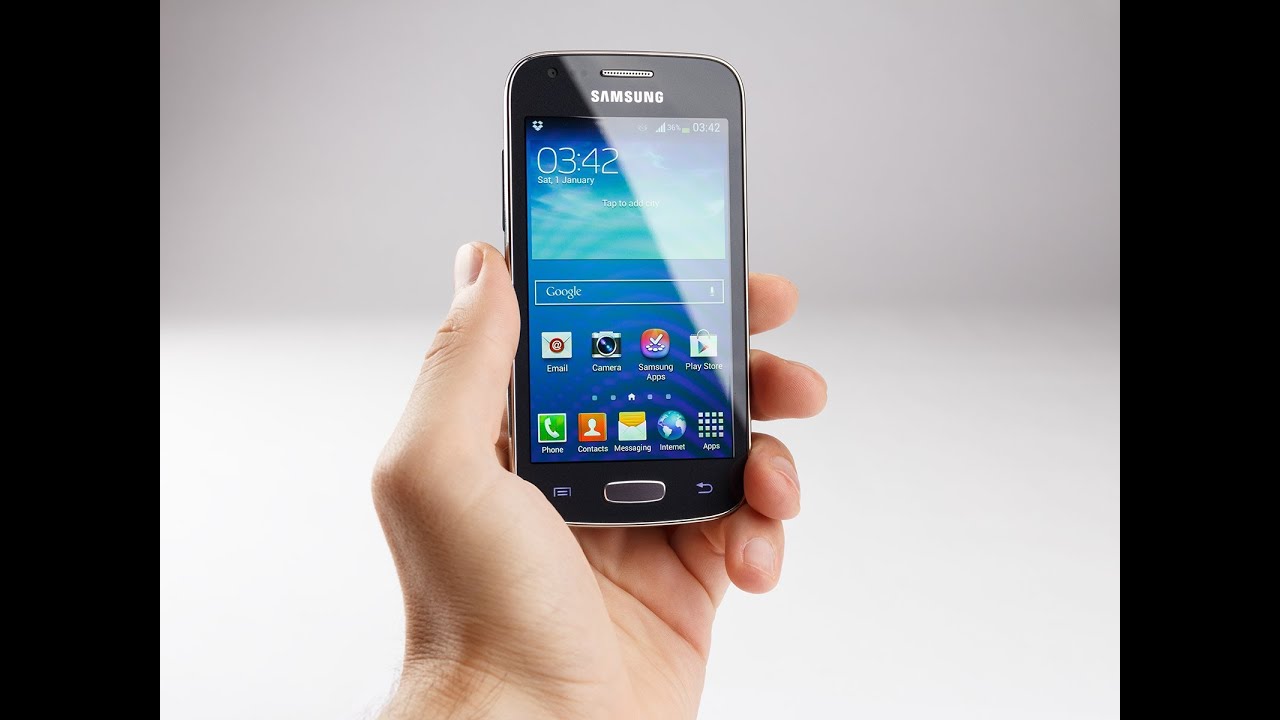
Design:
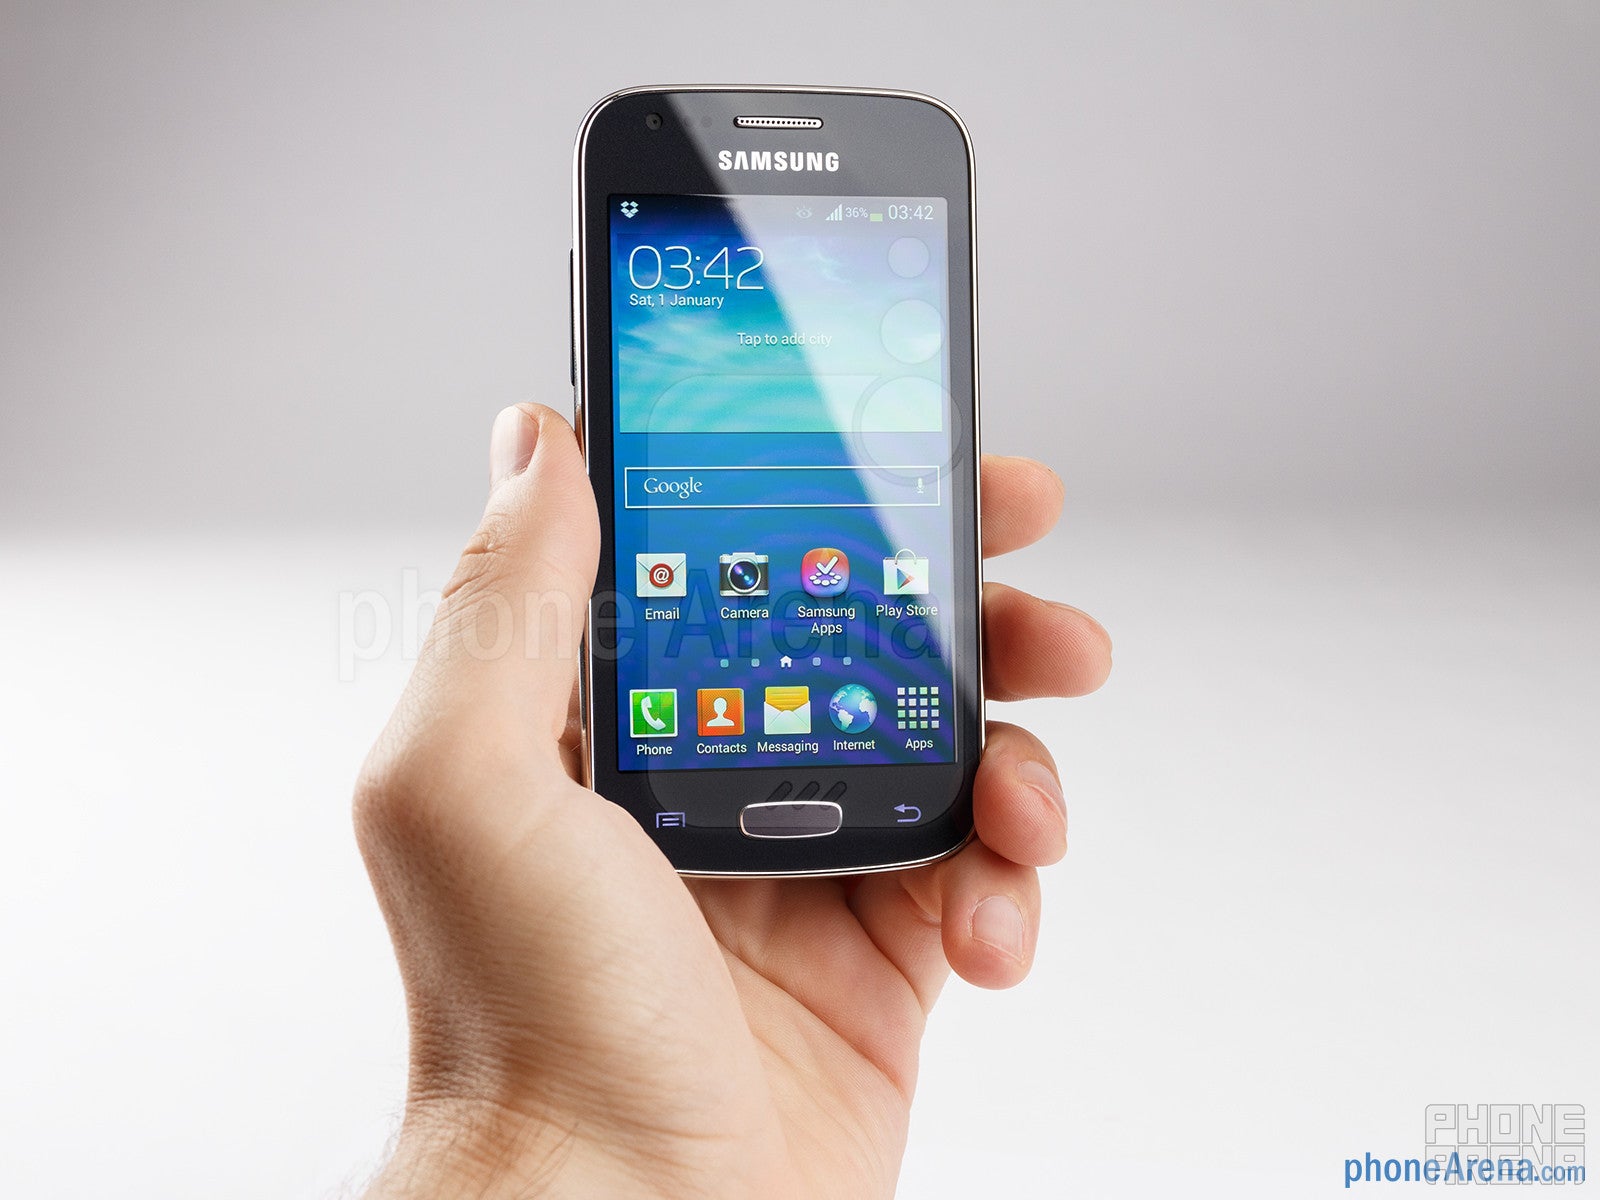
Molded in the tried and true chubby plastic traditions of Samsung, the Ace 3 hasn't gotten much prettier in its third iteration than the previous two. We have the LTE version of the phone for review, which is slightly thicker and heavier than the 9.8mm 3G version.
The typical soapy shape with tapered sides and metal-like rim around the front panel do look decent, though, and the dark blue patterned plastic on the back is a nice change from Samsung's glossy black covers of yesteryear.
The typical soapy shape with tapered sides and metal-like rim of the Galaxy Ace 3 do look decent
The phone has become slightly taller compared to the Ace 2, to accommodate the larger screen, but the side bezel has shrunk and the width has been kept almost identical, so the phone is very easy to hold and operate with one hand as well.
The volume rocker on the left and the power/lock key at the right are thin, but not uncomfortably so, and are very easy to feel and press, with good tactile feedback, as is the large physical home key underneath the display.
Display:
We get a 4” LCD screen with the Galaxy Ace 3, which sports 480x800 pixels of resolution, ringing in a decent for this class 233ppi pixel density. The screen sports good color representation and very nice viewing angles.
The panel's brightness is not very high, and its reflectivity is about average, meaning that outside under direct sunlight you'll have trouble telling what's going on, even at maximum luminance.
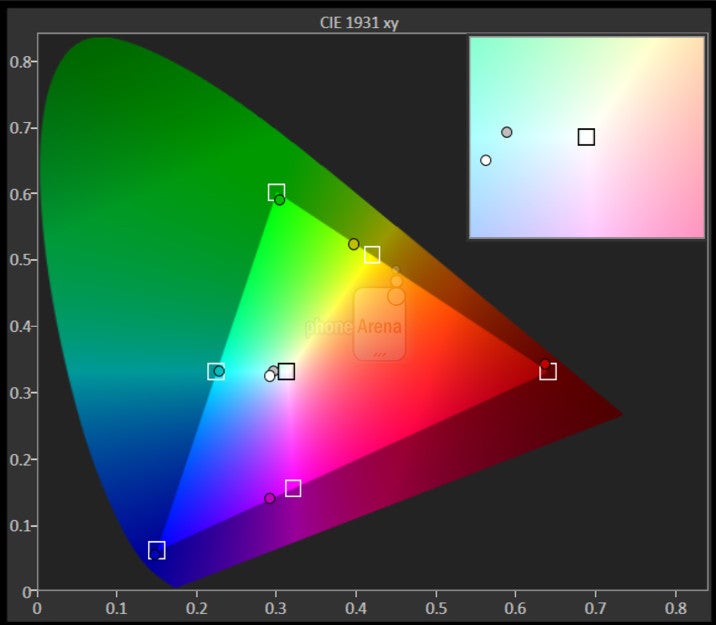
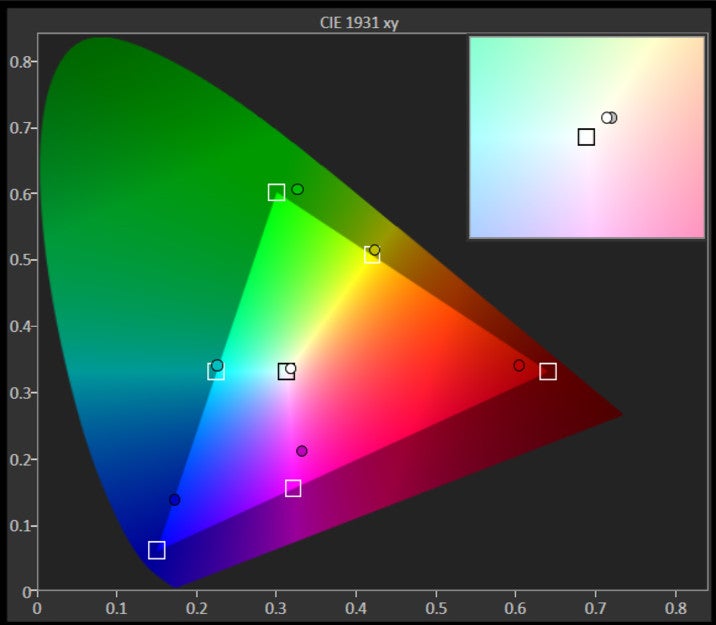
The numbers below represent the amount of deviation in the respective property,observed when a display is viewed from a 45-degree angle as opposed to direct viewing.
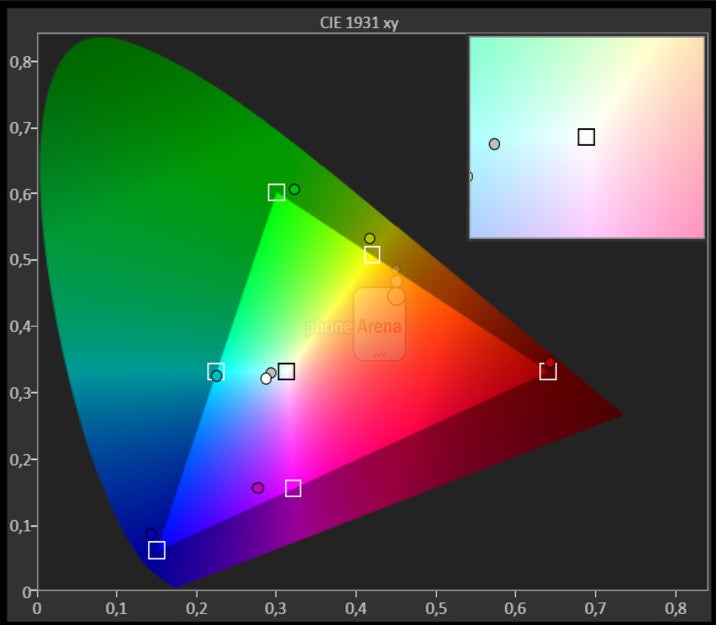
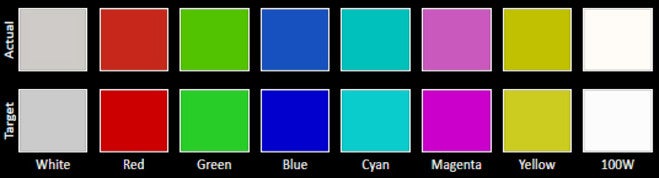
The CIE 1931 xy color gamut chart represents the set(area)of colors that a display can reproduce,with the sRGB colorspace(the highlighted triangle)serving as reference.The chart also provides a visual representation of a display's color accuracy. The small squares across the boundaries of the triangle are the reference points for the various colors, while the small dots are the actual measurements. Ideally, each dot should be positioned on top of its respective square. The 'x:CIE31' and 'y:CIE31' values in the table below the chart indicate the position of each measurement on the chart. 'Y' shows the luminance (in nits) of each measured color, while 'Target Y' is the desired luminance level for that color. Finally, 'ΔE 2000' is the Delta E value of the measured color. Delta E values of below 2 are ideal.
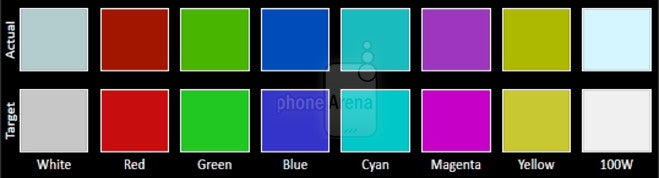
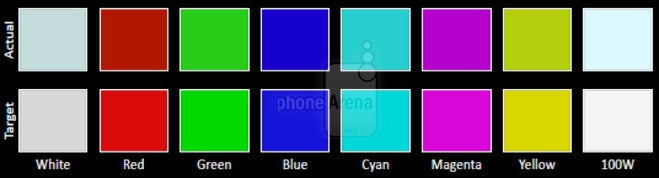
The Color accuracy chart gives an idea of how close a display's measured colors are to their referential values. The first line holds the measured (actual) colors, while the second line holds the reference (target) colors. The closer the actual colors are to the target ones, the better.
The Grayscale accuracy chart shows whether a display has a correct white balance(balance between red,green and blue)across different levels of grey(from dark to bright).The closer the Actual colors are to the Target ones,the better.
Samsung's latest TouchWiz Nature UX is painted over Android 4.2 on the Ace 3, so you pretty much know what to expect, as all the usual widgets and settings are present. From the bells and whistles that come with the flagship S4, here we only have S Travel that partners with TripAdvisor, Smart Stay and S Translator. The interface doesn't sport all the fancy transparencies and animations that the more powerful handsets from Samsung are able to display, and this, coupled with the run-of-the-mill resolution make the UI look a bit dated.
The Samsung Galaxy Ace 3 comes with the latest version of the TouchWiz Nature UX interface
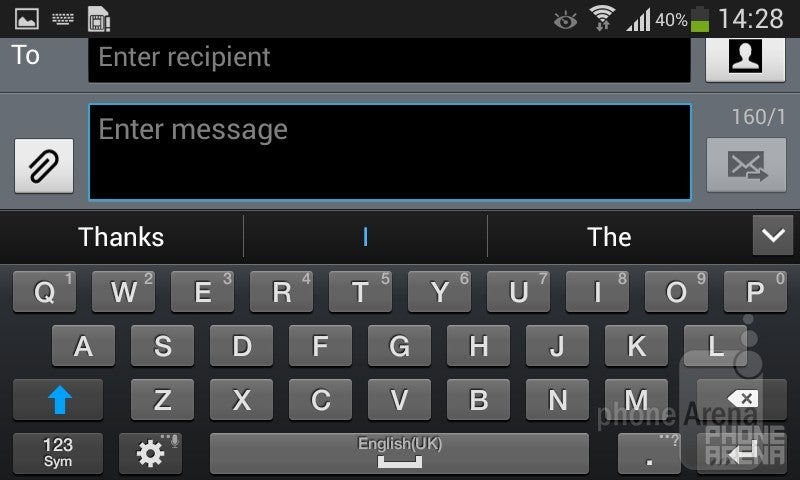
The on-screen keyboard comes with word prediction and over 50 different input languages
The on-screen keyboard comes with word prediction and over 50 different input languages to pick from, but it is not a stellar typing experience because of the squished key layout with large gaps on a fairly modest 4” display.
Processor and memory:
A 1 GHz dual-core processor is what's powering the 3G version of the Ace 3, which is modest for today's standard, and the LTE variance we have for review kicks it up a notch to a 1.2 GHz dual-core CPU with a PowerVR SGX544MP GPU.
The handset runs Android 4.2 Jelly Bean with minute hiccups during transitional animations, but app loading times as well as multitasking are carried out with decent speeds, though it is pretty visible that the phone is not a speed demon, as the benchmark tests below can attest.
The 3G version of the phone has 4 GB of internal memory (about 2 GB of which are user-available), and the LTE one sports 8 GB of storage (5 GB user-available), while Samsung has supplied a gig of RAM and a microSD slot for storage expansion on both.
QuadrantHigher is better
Samsung Galaxy Ace 33201
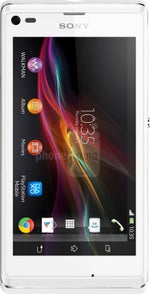
Sony Xperia L4223
AnTuTuHigher is better
Samsung Galaxy Ace 310628
Sony Xperia L9225
GFXBench Egypt HD 2.5 onscreen(fps)Higher is better
Granted, browsing on a 4” display is not as pleasant as on a 5- or even 6-incher, which are not a rarity these days, but the stock TouchWiz browser is quick to render pages and zooming is smooth. You can also display Adobe Flash content if needed, which is an advantage before the default Android browser Chrome.
Other than that, we aren't presented with anything out of the ordinary in terms of features – just the usual set of tools like Incognito mode, support for multiple windows, and playback of embedded YouTube videos.
The browser renders pages quickly and zooming is smooth
As we mentioned, the Ace 3 comes in two versions – one with LTE radio, for the respective carriers that support this fast 4G standard, in addition to HSPA+ download speeds up to 42.2 Mbit/s, while the 3G version comes with 14.4 Mbit/s radio only. There is also a version with two SIM cards that lets you use more than one carrier network at once.
The rest of the connectivity features for the 3G version are Wi-Fi, Bluetooth 4.0, A-GPS, Wi-Fi Direct, FM radio with RDS and that's about it, while the LTE variant throws in NFC as well.
Camera:
A 5 MP camera with LED flash is found on the back of the Galaxy Ace 3, with the new Nature UX camera interface accompanying it. The app offers a more limited number of shooting modes, which can be quickly picked from the carousel on the right, than Samsung's higher-resolution phone cameras. There are no Rich Tone (HDR) capabilities, for example, but the Best Shot, Sound&Shot and Panorama options are present, as well as a Macro mode.
The camera interface of the Samsung Galaxy Ace 3
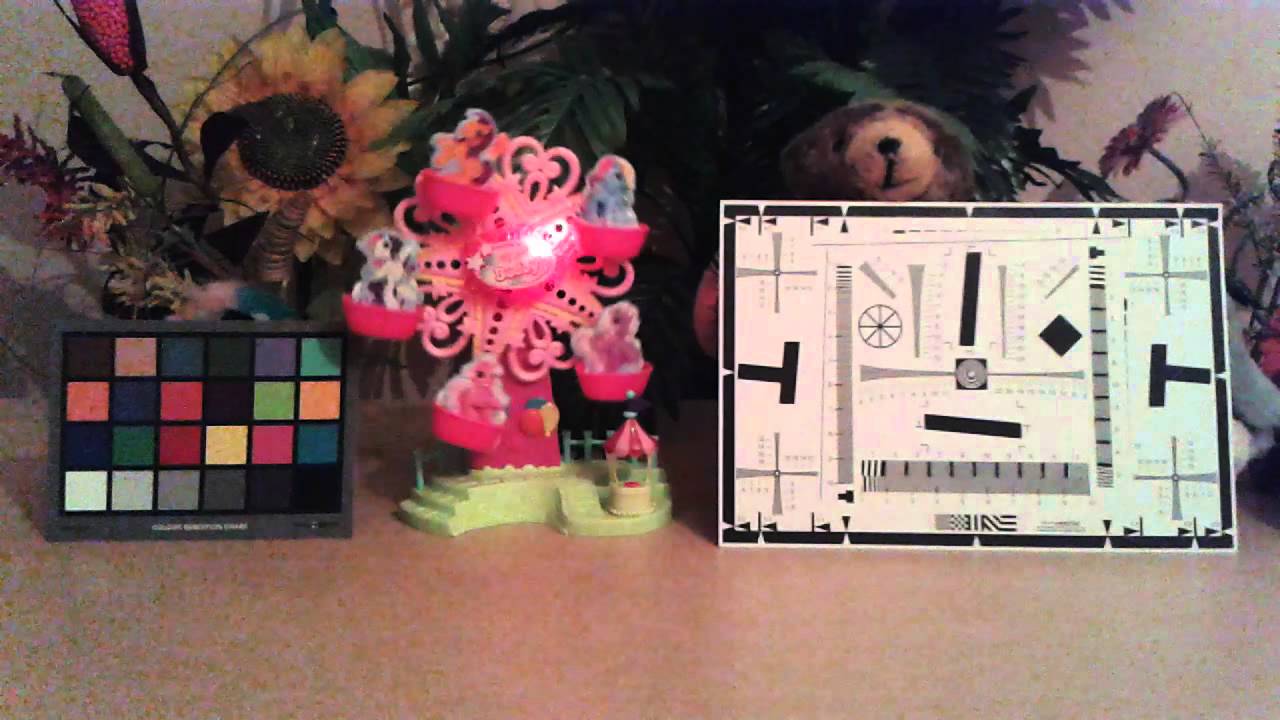
The pictures look pretty good for an unassuming camera, as was the case with the Ace 2. We wish there was some more detail in the pictures, but color representation is quite accurate, and the phone's auto setting capture the scenes correctly, though there are some shadow clippings in high dynamic range situations. There are no white balance issues and the contrast is pumped up a notch by default, which yields pretty pleasant to look at results.
Samsung Galaxy Ace 3 Sample photos
The handset does video recording with 720p resolution at 30fps, which should be the bare minimum nowadays, and in that regard is the same as its 2012 predecessor. There are some artifacts present from time to time, but other than that the video runs smooth, with good amount of detail and accurate color presentation. That's outdoors, with enough daylight, however, while low-light and video is extremely noisy. Of note is that the microphone picks up audio with very good and clean volume while recording the footage.
The gallery offers Samsung's split view mode that keeps your folders on the left, and their content on the right for easier access. You can also edit the photos with a bunch of enhancement options and color effects directly from the app itself, as usual with TouchWiz, but here the Photo Editor option has to be downloaded separately.
Music playback is done via the TouchWiz stock player, which offers an abundance of sound modes and equalizer presets. The loudspeaker is of average strength, but emits a comparatively clean sound with no audible distortions towards the highest volume.
Recommended For You
Listening to music is handled by the stock TouchWiz player
The video player handles most major formats
The video player runs most major formats without a hitch, including MKV and Xvid files, and up to 1080p resolution at that, though for some reason it doesn't play DivX files out of the box.
The earpiece of the Galaxy Ace 3 sounds very loud, to the point that we had to take volume down three or four marks, and the voices come in rather clean and distinct. The microphone is also a good performer, relaying our voices to the other side with a strong volume, though with some distortion and hissing at certain consonants and combos like “s” or “sh”.
Battery:
Since LTE connectivity requires more juice, Samsung has supplied that version of the Galaxy Ace 3 with a 1800 mAh battery, while the thinner 3G variant has a 1500 mAh unit. No official talk and standby times are given for the handset yet, but with these battery capacities something tells us it won't be an endurance king anyway.
We measure battery life by running a custom web-script,designed to replicate the power consumption of typical real-life usage.All devices that go through the test have their displays set at 200-nit brightness.
When Samsung slapped the slogan “Enjoy the New Mobile Essentials” on the Galaxy Ace 3, it meant it. The phone is a very mild upgrade over its predecessor the Ace 2, and only the LTE version offers more internal memory and a faster 4G radio, which will likely come at a heftier price.
The price will ultimately be what determines the Ace 3 success, as, besides the Samsung branding and newest Android version, it doesn't offer much differentiation in the sea of humble midrangers. Thus it better be priced lower than last year's Galaxy S III Mini, for instance, since that one has very similar dimensions, but is more elegant and has more internal memory out of the box.
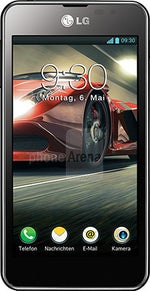
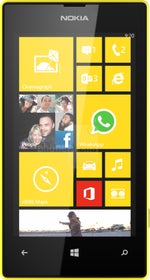
Other direct competitors are LG's Optimus F5, with similar specs, but a slightly larger display, and the Sony Xperia P with the same screen size, but higher resolution, and with more internal memory. If we look at the Windows Phone world, the Nokia Lumia 520 beckons in multiple colors with similar specs and a rock bottom pricing.
Daniel, a devoted tech writer at PhoneArena from 2010 to 2025, has been engrossed in mobile technology since the Windows Mobile era. His expertise spans mobile hardware, software, and carrier networks, and he's keenly interested in the future of digital health, car connectivity, and 5G. Beyond his professional pursuits, Daniel finds balance in travel, reading, and exploring new tech innovations, while contemplating the ethical and privacy implications of our digital future.
Recommended For You
COMMENTS (19)
COMMENTS (19)
All comments need to comply with our
Community Guidelines
PhoneArena Community Rules
A discussion is a place, where people can voice their opinion, no matter if it
is positive, neutral or negative. However, when posting, one must stay true to the topic, and not just share some
random thoughts, which are not directly related to the matter.
Things that are NOT allowed:
Off-topic talk - you must stick to the subject of discussion
Offensive, hate speech - if you want to say something, say it politely
Spam/Advertisements - these posts are deleted
Multiple accounts - one person can have only one account
Impersonations and offensive nicknames - these accounts get banned
To help keep our community safe and free from spam, we apply temporary limits to newly created accounts:
New accounts created within the last 24 hours may experience restrictions on how frequently they can
post or comment.
These limits are in place as a precaution and will automatically lift.
Moderation is done by humans. We try to be as objective as possible and moderate with zero bias. If you think a
post should be moderated - please, report it.
Have a question about the rules or why you have been moderated/limited/banned? Please,
contact us.


Things that are NOT allowed:
To help keep our community safe and free from spam, we apply temporary limits to newly created accounts: