
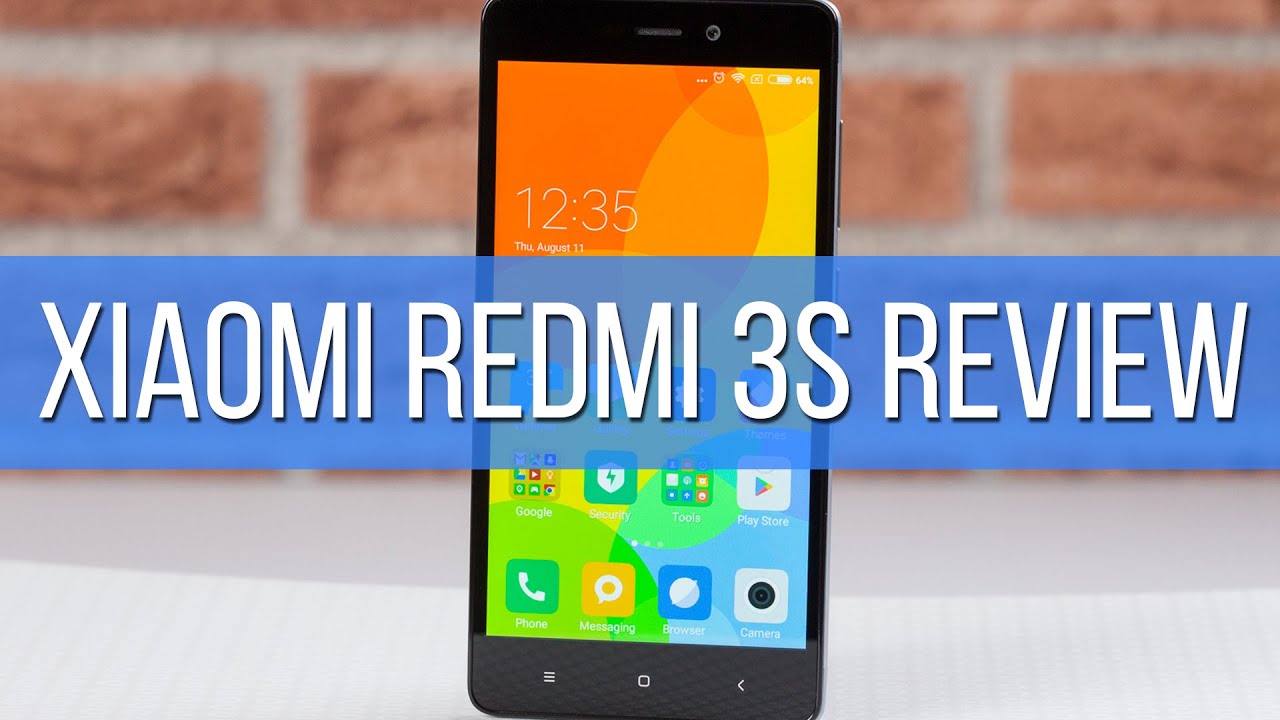
Xiaomi Redmi 3S Review
Introduction
Low-cost Chinese smartphone vendor Xiaomi is at it again, presenting the latest addition to its Redmi line-up of affordable devices, the Redmi 3S. Priced somewhere between $100 – $160 in China (the price ending up a bit higher for global consumers), the handset aims to up people's expectations for affordable phones with a quality build, adequate performance with up-to-date hardware, a decent camera, and a long-lasting battery. Let's put the new pretender through its paces and see how attractive of a proposition it ultimately is!
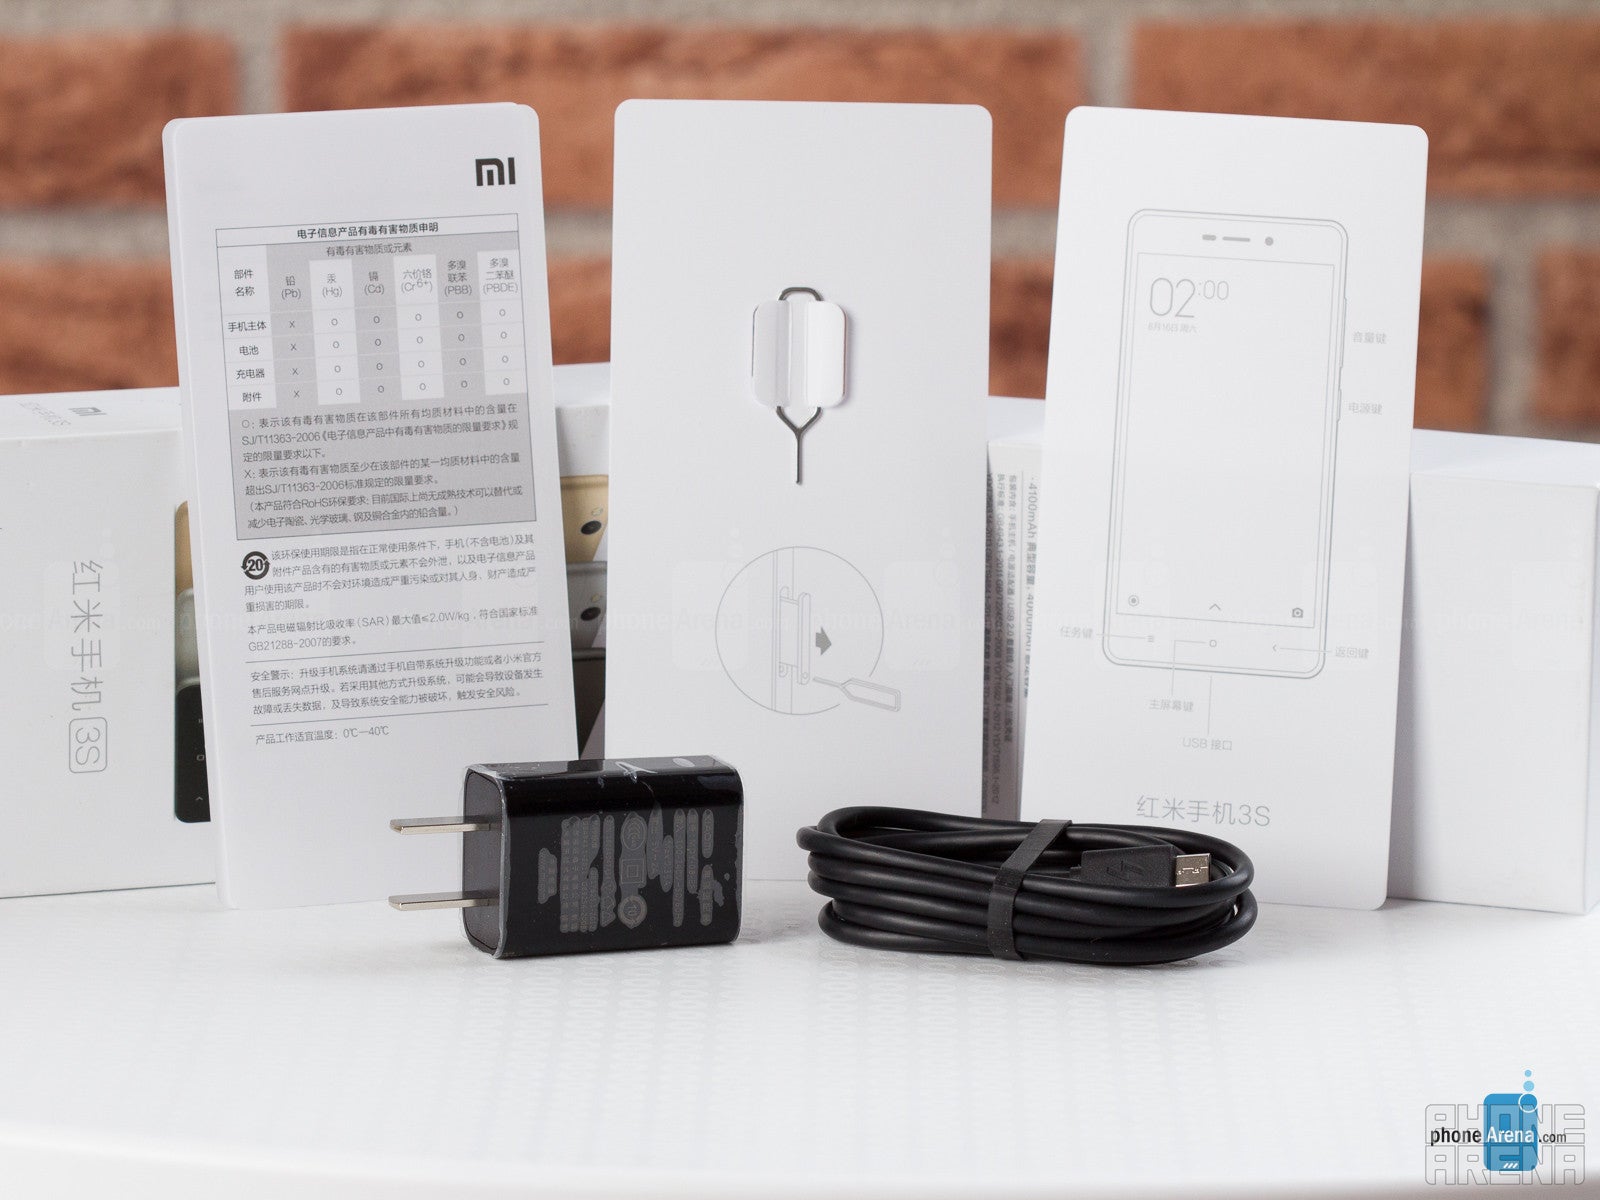
- Xiaomi Redmi 3S
- Data and charging cable
- Charger
- SIM ejector tool
- Informational pamphlet
Design
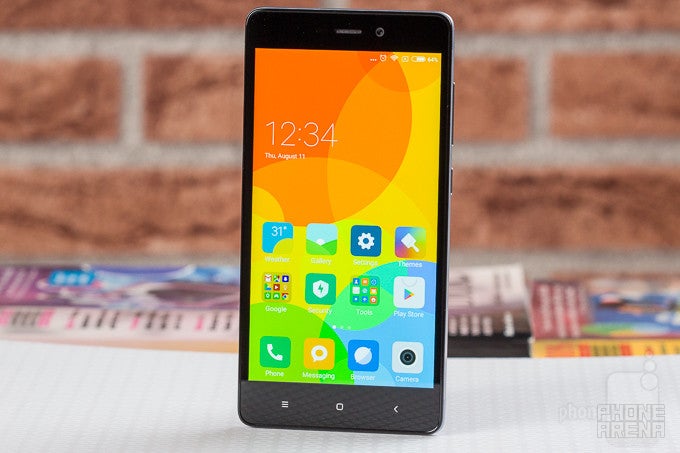
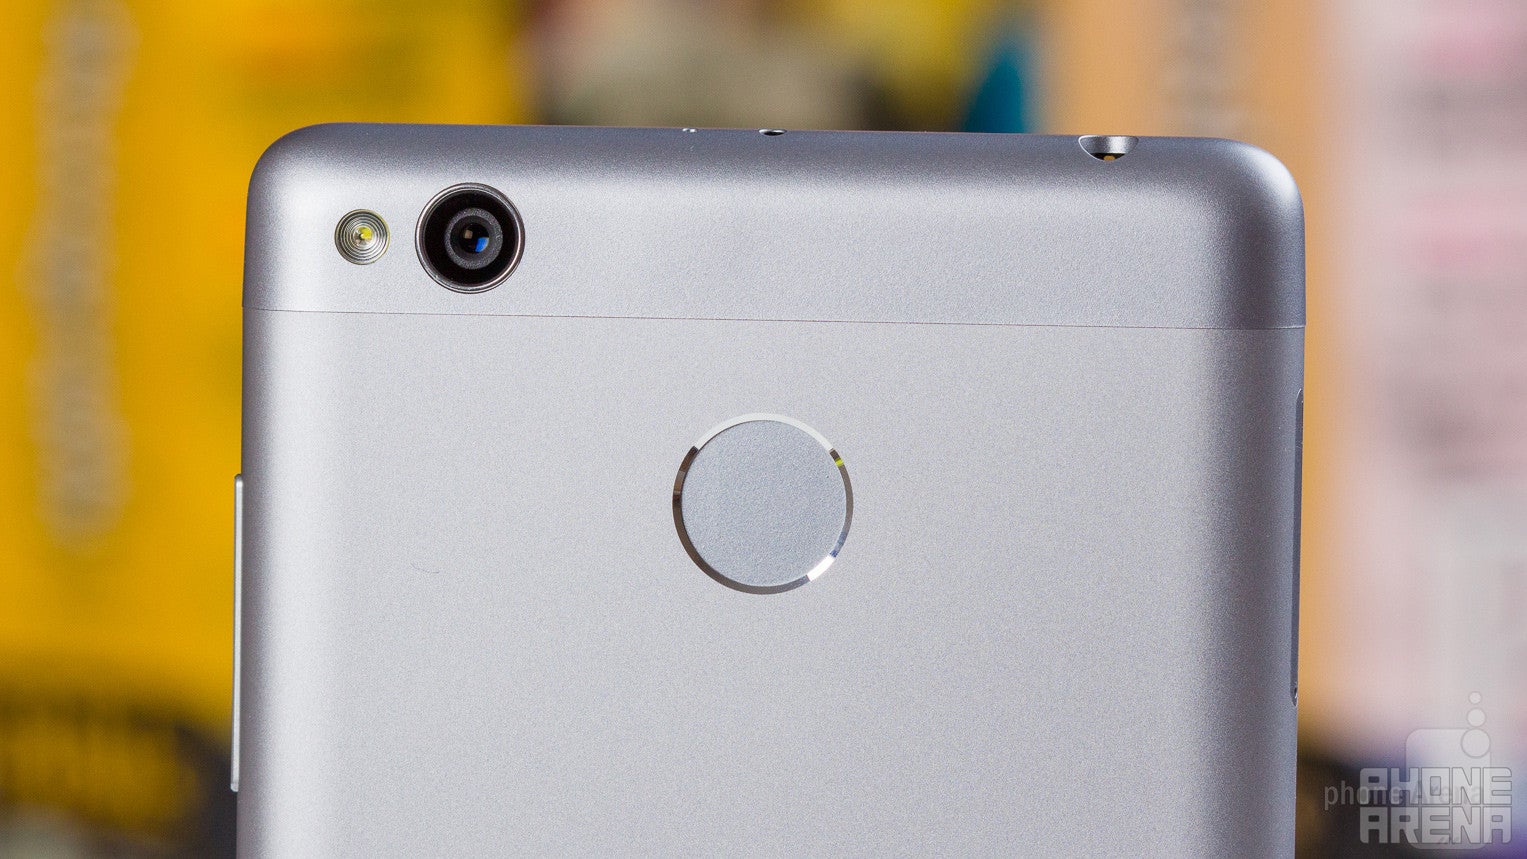
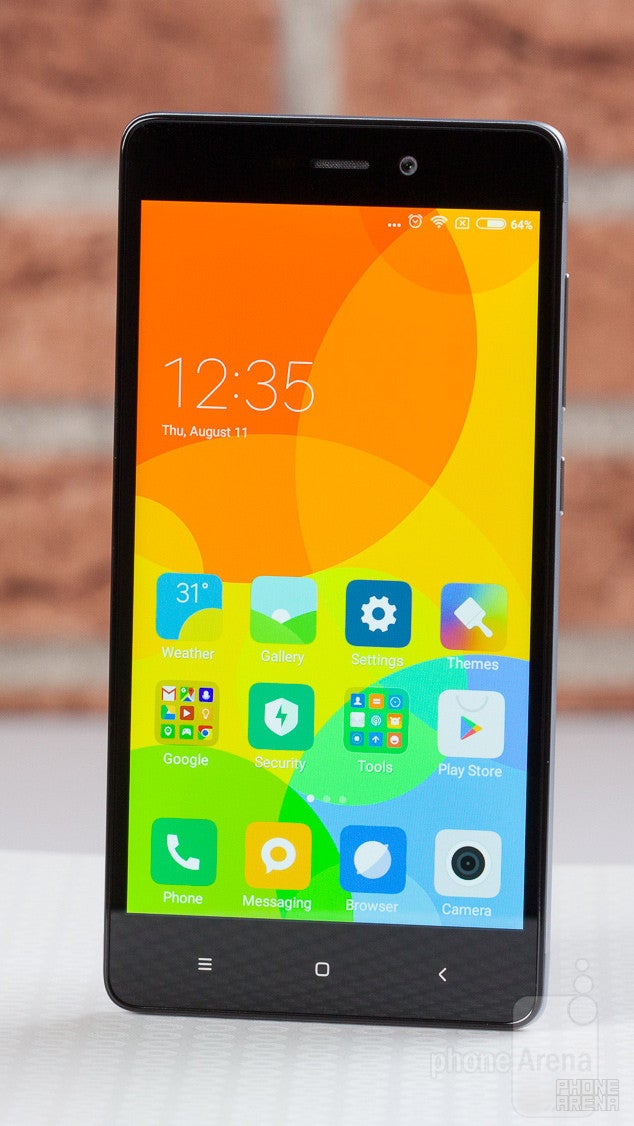
The metal and plastic build is unquestionably generic, but pleasant nonetheless.
The Xiaomi Redmi 3S is among the best-looking devices in its price category. While the design is objectively generic, this is still an elegant phone made of metal, with plastic substituting the aluminum for the top and bottom parts to aid signal reception. At 8.5mm thickness and 144 grams, the phone feels light, but sturdy. It has capacitive touch keys below the screen, a standard microUSB port, and the fingerprint sensor is placed on the back. Sold in Silver, Gray, and Gold, the phone leaves no complaints in the design department.

5.48 x 2.74 x 0.33 inches
139.3 x 69.6 x 8.5 mm
5.08 oz (144 g)

5.74 x 2.85 x 0.32 inches
145.8 x 72.3 x 8.1 mm
5.57 oz (158 g)

6.02 x 3.02 x 0.39 inches
153 x 76.6 x 9.8 mm
5.47 oz (155 g)

5.96 x 3 x 0.32 inches
151.3 x 76.3 x 8.15 mm
5.57 oz (158 g)

5.48 x 2.74 x 0.33 inches
139.3 x 69.6 x 8.5 mm
5.08 oz (144 g)

5.74 x 2.85 x 0.32 inches
145.8 x 72.3 x 8.1 mm
5.57 oz (158 g)

6.02 x 3.02 x 0.39 inches
153 x 76.6 x 9.8 mm
5.47 oz (155 g)

5.96 x 3 x 0.32 inches
151.3 x 76.3 x 8.15 mm
5.57 oz (158 g)
Compare these and other phones using our Size Comparison tool.
Display
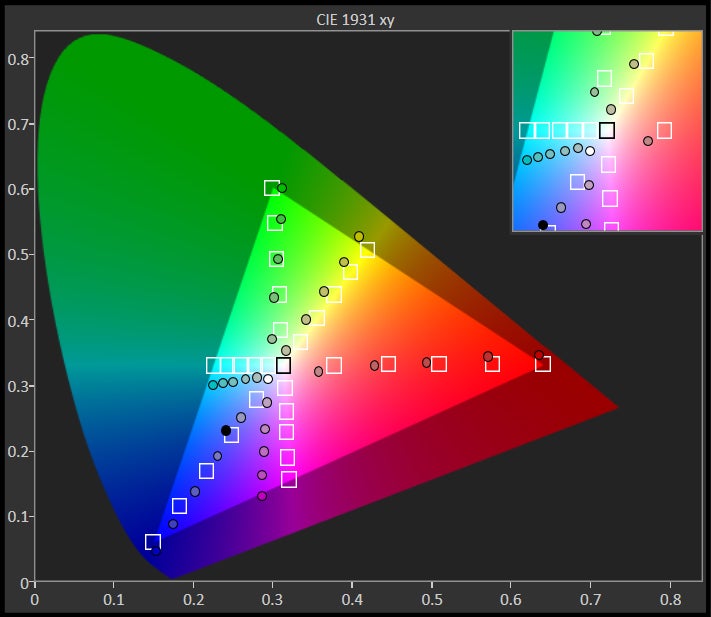
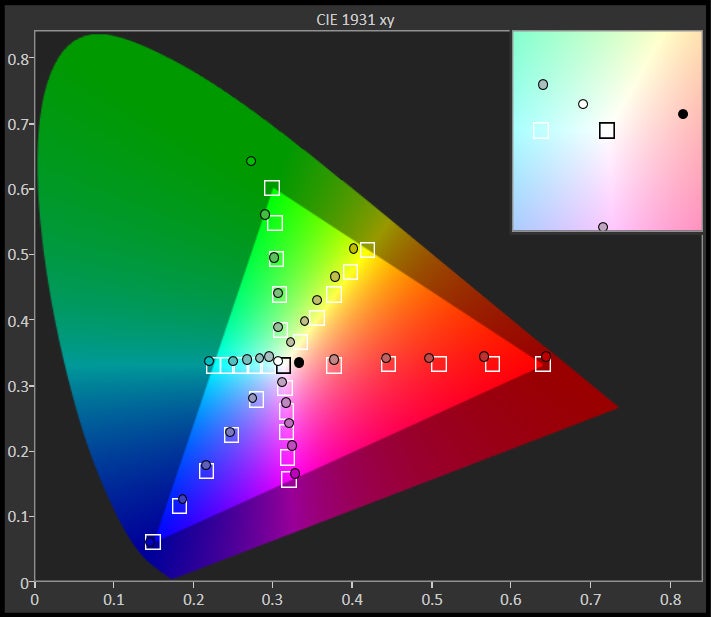
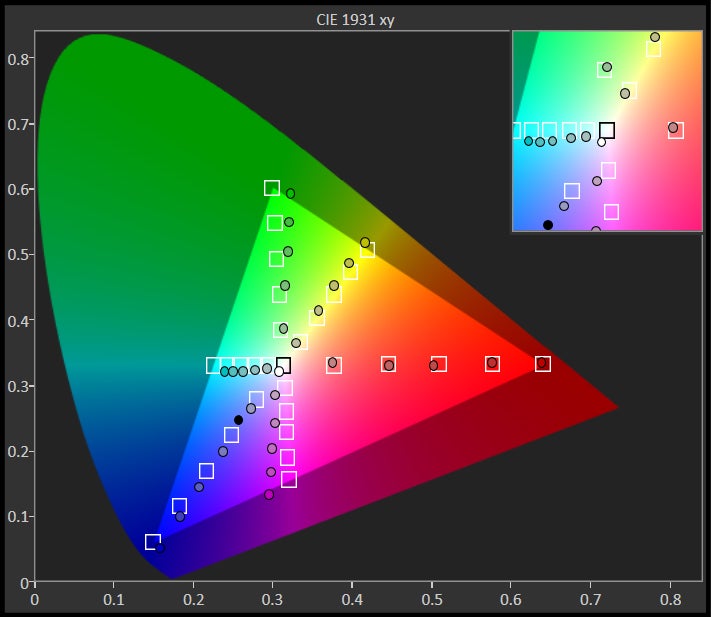
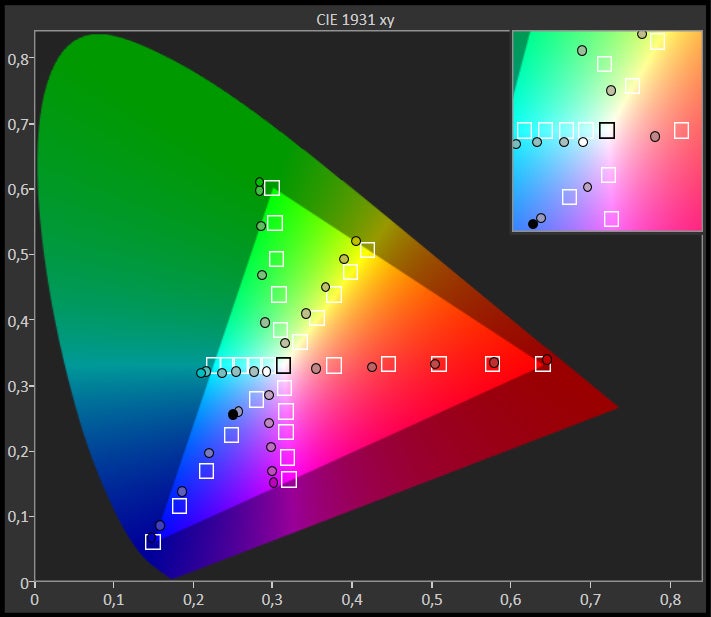
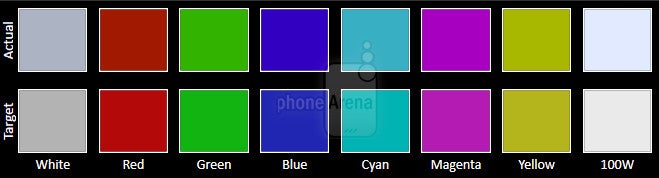
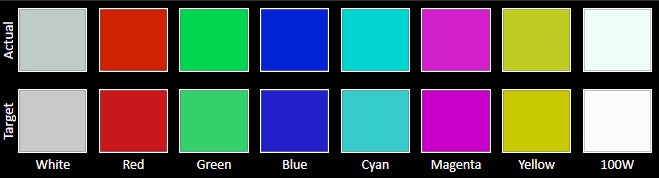
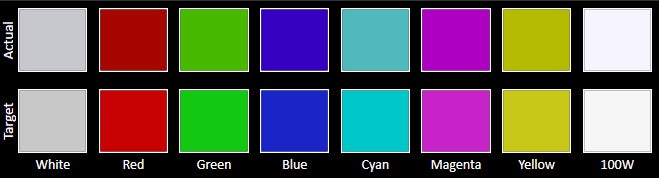
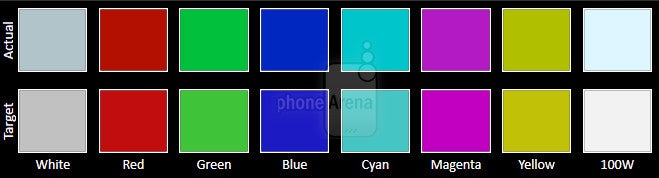
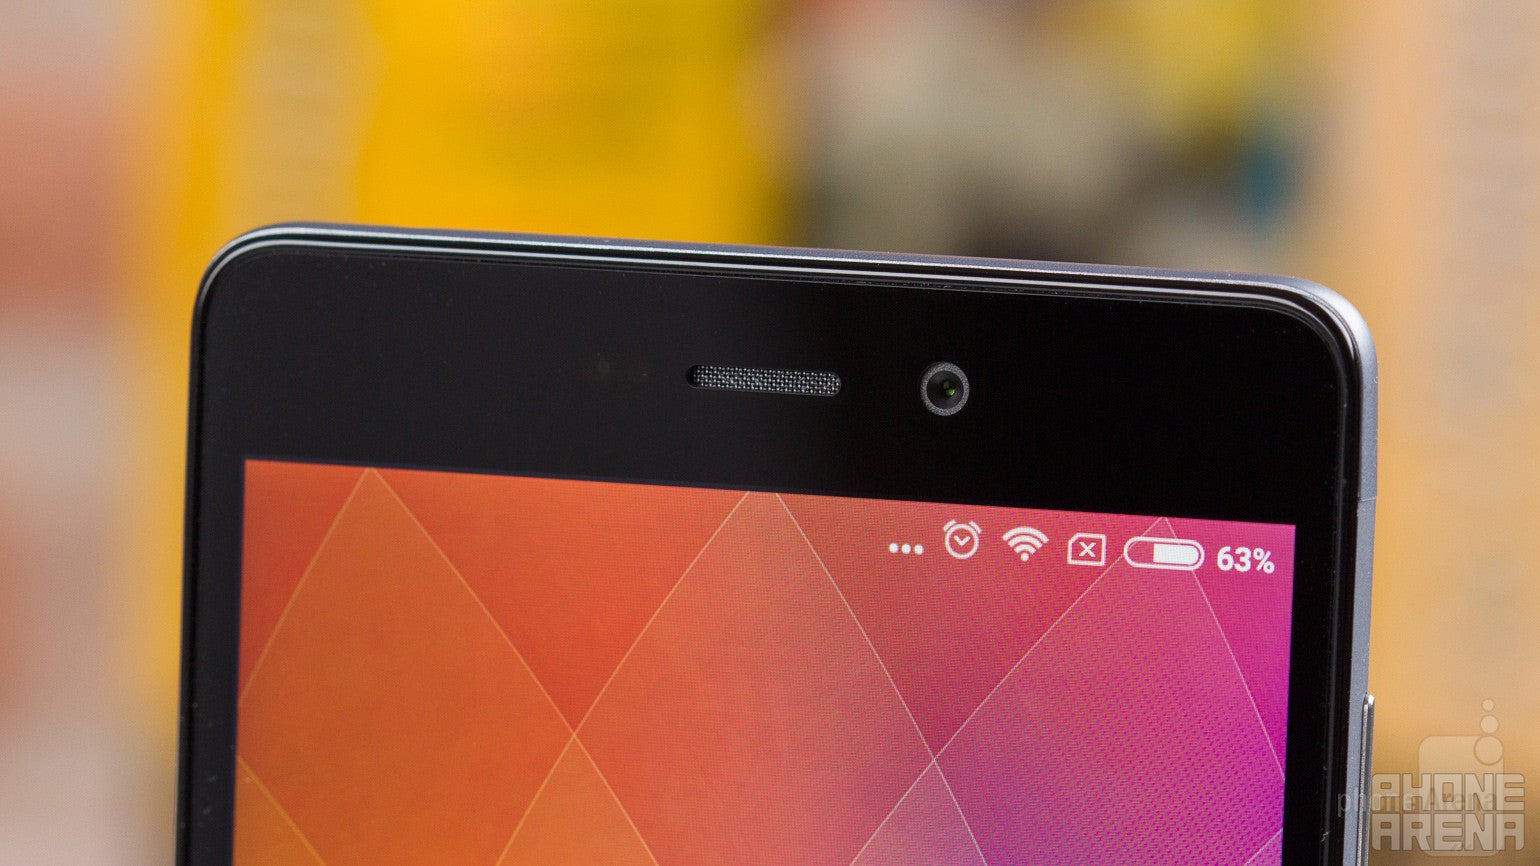
An okay display whose resolution could have been higher and color temperature warmer.
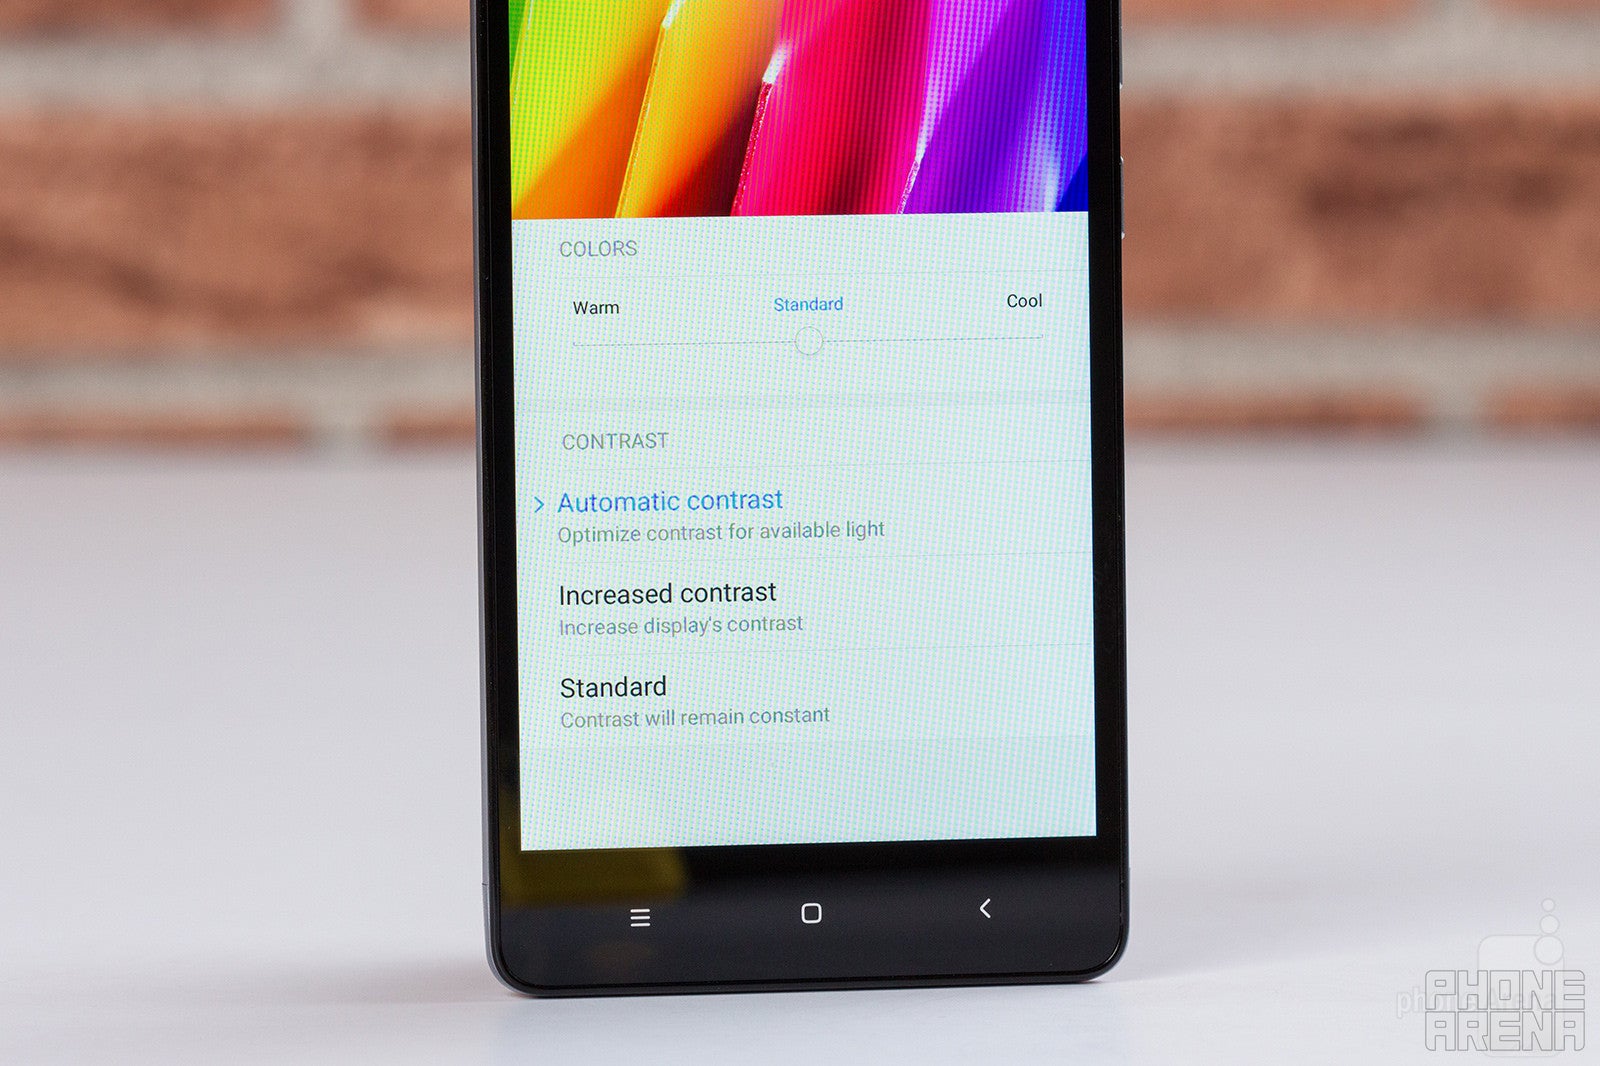
Outfitted with a 5-inch, 720p resolution IPS panel, the Redmi 3S display is certainly nice, but it also shows the corners cut by Xiaomi. A 1080 x 1920 px resolution would have fared better for a screen this size, improving its sharpness. Still, the presence of a night reading mode and a color temperature adjustment slider is quite welcome. While colors appear quite cold by default (at 7942 Kelvin), the screen boasts nice brightness properties and a fairly good contrast ratio. It may be an average panel, but it does the job well enough and it doesn't strain the eyes with odd imperfections and major unpleasantness.


Interface
Android Marshmallow and MIUI 8 are a winning combo, even on a low-end device.
MIUI isn’t without its flaws, though. Some visual elements do appear rather small, while apps like Messaging and e-mail lack landscape mode support for some reason. Notification management for certain apps is also implemented somewhat poorly. Users can take advantage of Xiaomi's Mi Cloud service to back up and store their data, while the theming engine lets you refresh MIUI's appearance. It's worth mentioning that our unit came with Play Store, but none of the Google apps installed. If need be, you can install them easily, so you aren't stuck with what you got.
Processor and Memory
Don’t expect miracles out of this modest handset, though it could still hold its own.
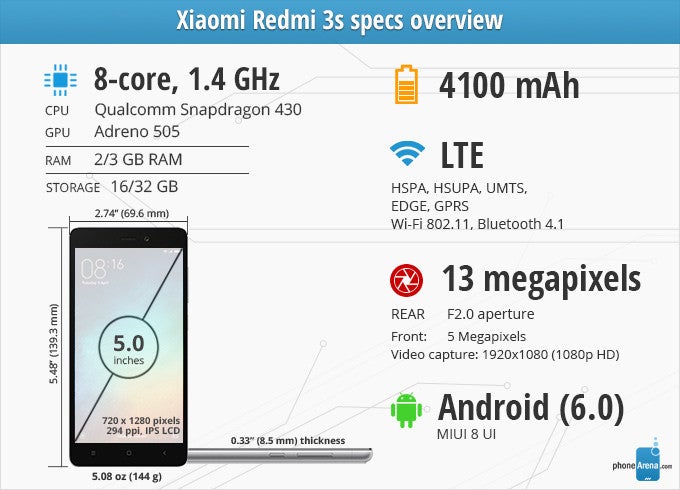
Xiaomi equipped the base model Redmi 3S with Qualcomm's low-end Snapdragon 430 chipset, which houses a 64-bit octa-core CPU with four cores clocked to 1.4GHz, and the other cooked up to 1.1GHz. Paired with 2GB of LPDDR4 RAM (or 3GB, if you buy the beefier model), the hardware muscle is decent and the phone operates smoothly, but it's also a barrier between the Redmi 3S and truly dazzling 3D games. Thankfully, general daily usage, browsing, and casual gaming don't pose a challenge, although the handset certainly isn't as quick as beefier mid-range and high-end Android phones, so tame those expectations.
Camera
A surprisingly good pair of cameras by low-end phone standards.
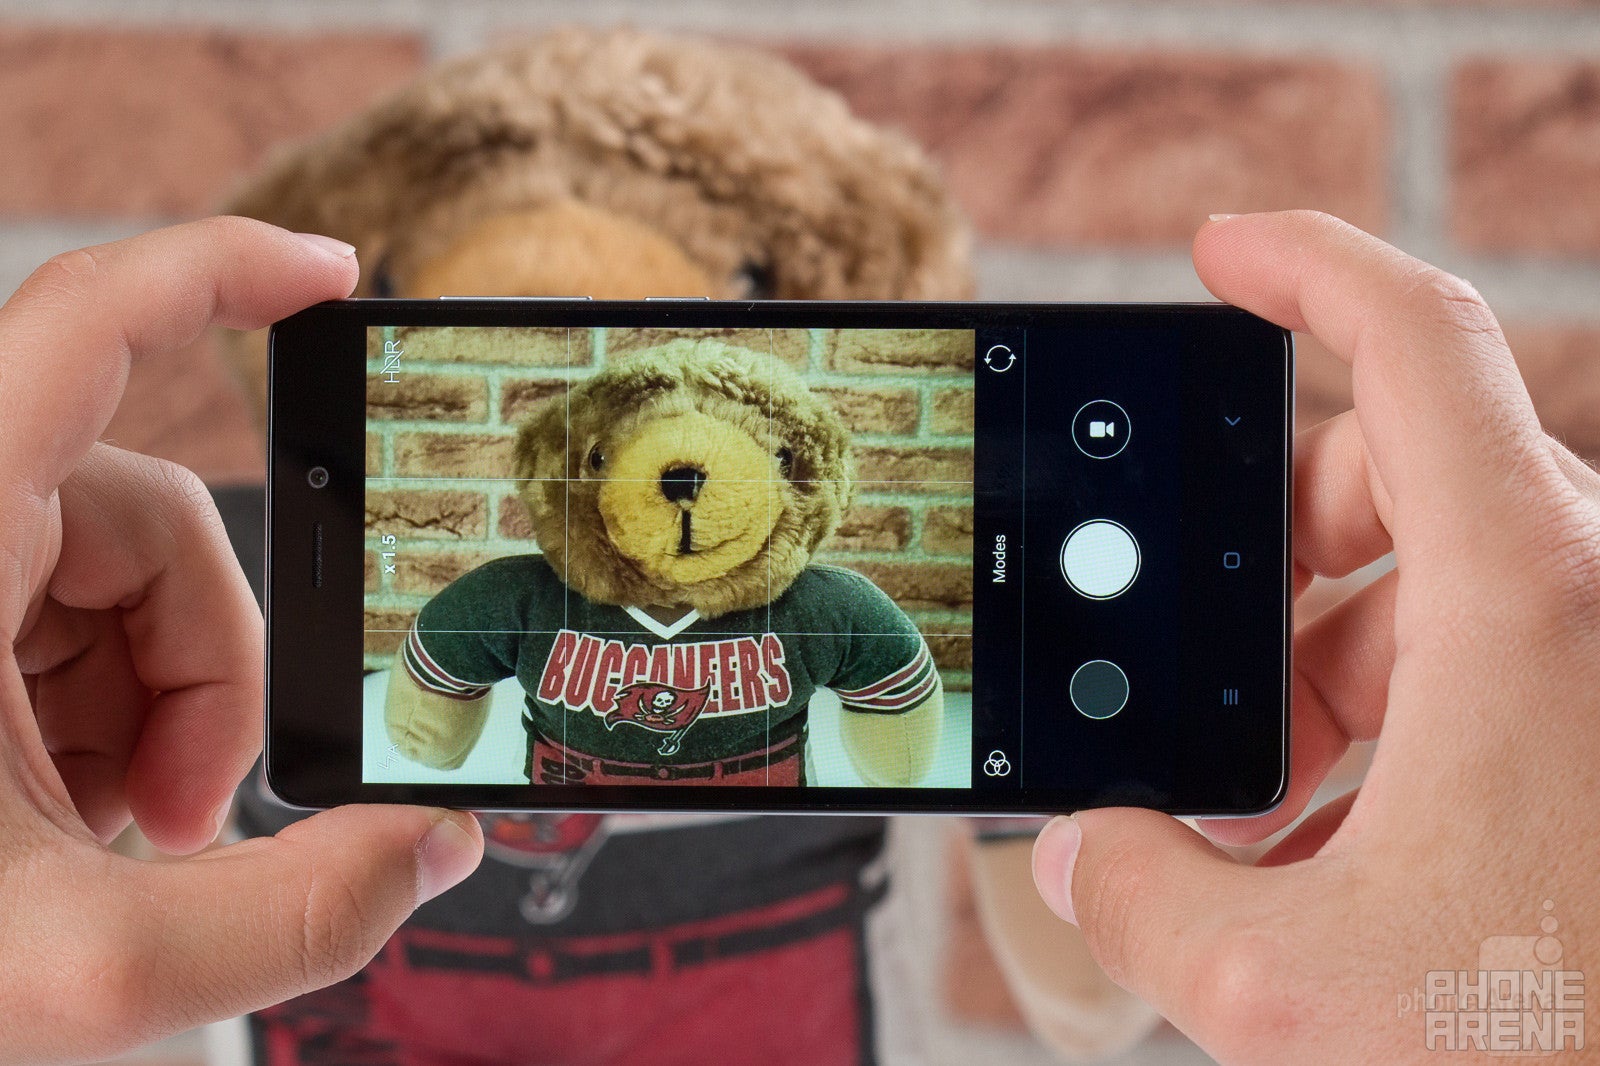
We took the Redmi 3S out for a spin on a sunny day and returned with surprisingly good photos. No, they aren't outstanding, but the only gripes we got have to do with over-saturated colors and lack of fine detail. The automatic exposure and overall illumination of objects in the dark also leave something to be desired. But, objectively, all of these are minor shortcomings for an entry-level device. You can feel confident having this 13MP camera with you, and that's what matters.
Xiaomi Redmi 3S sample images
Video recording
While 1080p resolution videos look good and crisp, the image stabilization is poor and the recorded sound is too aggressively filtered and unpleasant. There's no automatic autofocus, which means you'll have to tap manually, and getting objects in front of the camera in focus can take a while, potentially missing an important moment. If you aren't recording overly dynamic scenes and don't mind the hissy sound, the Redmi 3S can be a passable camcorder.
Xiaomi Redmi 3S sample videos
Multimedia
The Redmi 3S is adequate for video watching and music playback with its 5-inch display and reasonable, though still somewhat low headphone output. The bundled video and music players provide all the necesarry functionality, but little bells and whistles. You can realistically hold on to them before reaching for third-party alternatives.
Connectivity
No worldwide network support is a major bummer.
Currently, the Redmi 3S is limited to Chinese 4G network support, although there's a chance the Qualcomm modem will make it possible for the phone to be used globally. The handset is capable in regards to connectivity, as there are Wi-Fi 802.11 b/g/n/, Wi-Fi Direct, Bluetooth 4.1m and GPS on-board. A well-rounded package all around, although buyers outside of China ought to steer clear.
Call quality
Good sounding, if a bit aggressively filtered conversations.
Claiming no surprise shots, the Redmi 3S delivers normal sounding, if aggressively noise-filtered conversations, both incoming and outgoing. The earpiece and speaker aren't the loudest, but they suffice.
Battery life
A winning contender in the discipline of longevity.
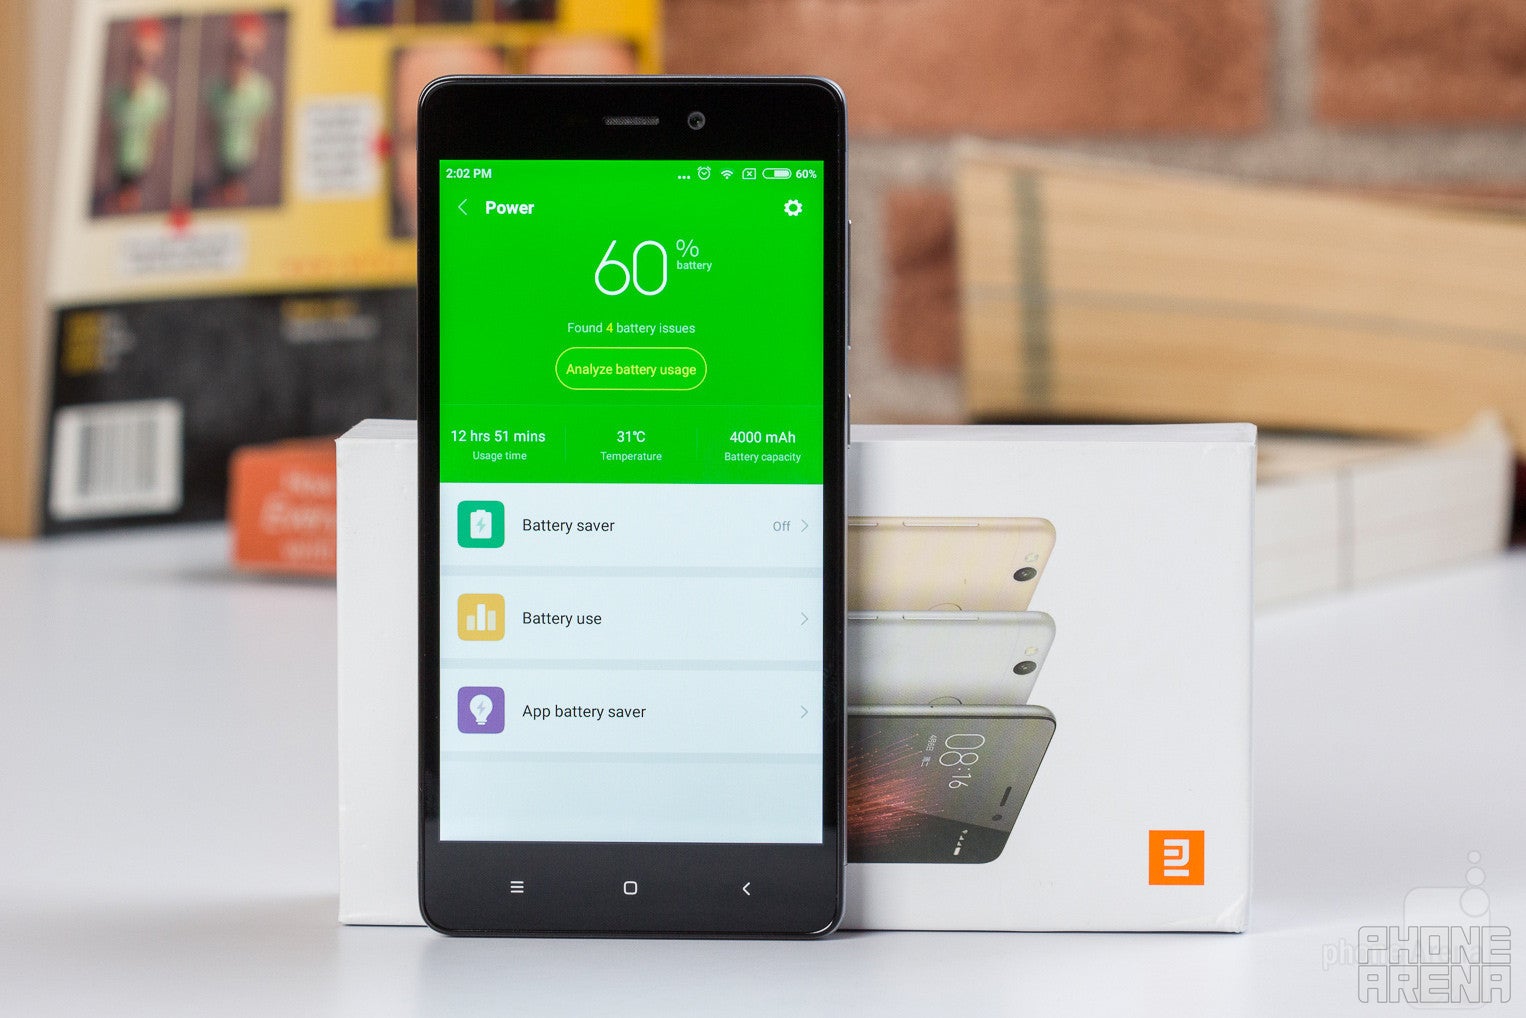
If display and performance are obvious corners cut by Xiaomi, battery life is quite the opposite – a massive 4100mAh unit is what the Redmi 3S has in store. Paired with the frugal screen and CPU, the battery had no problems lasting 13 hours and 39 minutes of constant simulated on-screen use in our battery test. The Redmi 3S also features Qualcomm's fast charging technology for users' convenience, but the bundled charger isn't of the fast kind. It takes 190 minutes to recharge from zero with it, which is a lot of time to wait.
Conclusion
The base model Redmi 3S certainly packs a lot of punch for such a cheap device, but it's a smartphone made primarily for Chinese customers. While the absence of world network support can be corrected with the required changes and certifications, the inevitable price markup and lack of warranty or customer support will make the smartphone less appealing for the global crowd. Expect to pay at least $250 or more, unless you catch a promotion. For that kind of money, smartphones like the Motorola Moto G4 or older flagship phones can deliver a significantly better experience across the board.
Otherwise, the Redmi 3s is a solid handset with good looks, an alright screen, decent performance, better than average camera, and very good battery life. The Redmi 3S shows how cheapie Android smartphones can still be rather charming.
Follow us on Google News


Things that are NOT allowed:
To help keep our community safe and free from spam, we apply temporary limits to newly created accounts: