Xiaomi Mi Max Review
Introduction
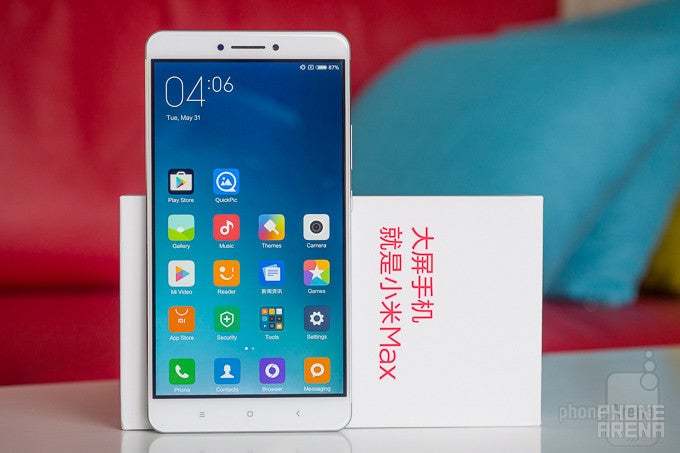
6 years since its inception, Chinese smartphone maker Xiaomi is still busy selling quality handsets at pupil-dilating prices. The Mi Max is its newest proposition – a gargantuan 6.44-inch phablet with a sleek metal body, nice specs, and seemingly great value for the ~$230 that Xiaomi wants for the base model. Is this another fledgling success for Xiaomi? Well, let's see!
Design
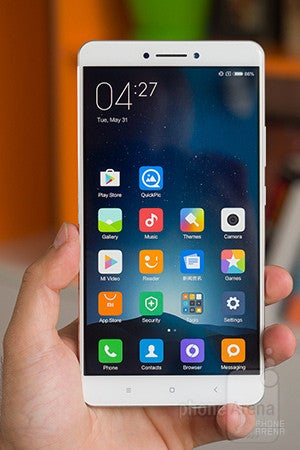
This is one of the largest phones you've ever seen...
Unabashedly enormous it may be, but Xiaomi's phablet exhibits trim bezels and sides, a sleek metal body, and reasonable weight. Make no mistake, it's still a device that few jean pockets can contain, and it does demand two-handed usage, but it's not uncomfortable. Unlocking it with the fingerprint sensor on the back is quick and feels natural. We are also fond of the power and volume keys which are tight and sturdy. Overall, we think the Mi Max's design and build quality rank pretty well in its peculiar class. We would have loved a USB Type-C port in place of the microUSB one, though – it's a somewhat dated component on an otherwise modern device.

6.81 x 3.48 x 0.3 inches
173.1 x 88.3 x 7.5 mm
7.16 oz (203 g)

6.19 x 3.17 x 0.31 inches
157.1 x 80.6 x 7.9 mm
6.53 oz (185 g)

6.37 x 3.19 x 0.29 inches
161.7 x 80.9 x 7.4 mm
7.05 oz (200 g)

7.35 x 3.8 x 0.3 inches
186.6 x 96.6 x 7.6 mm
8.08 oz (229 g)

6.81 x 3.48 x 0.3 inches
173.1 x 88.3 x 7.5 mm
7.16 oz (203 g)

6.19 x 3.17 x 0.31 inches
157.1 x 80.6 x 7.9 mm
6.53 oz (185 g)

6.37 x 3.19 x 0.29 inches
161.7 x 80.9 x 7.4 mm
7.05 oz (200 g)

7.35 x 3.8 x 0.3 inches
186.6 x 96.6 x 7.6 mm
8.08 oz (229 g)
Compare these and other phones using our Size Comparison tool.
Display
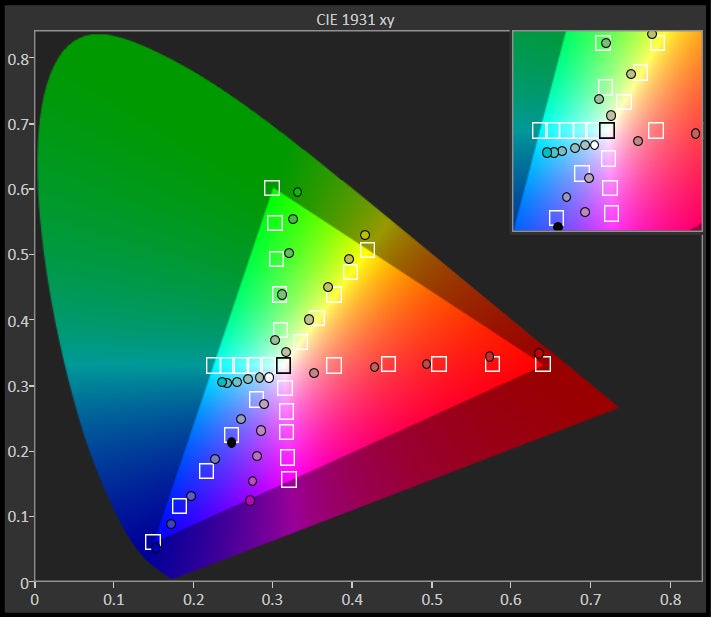
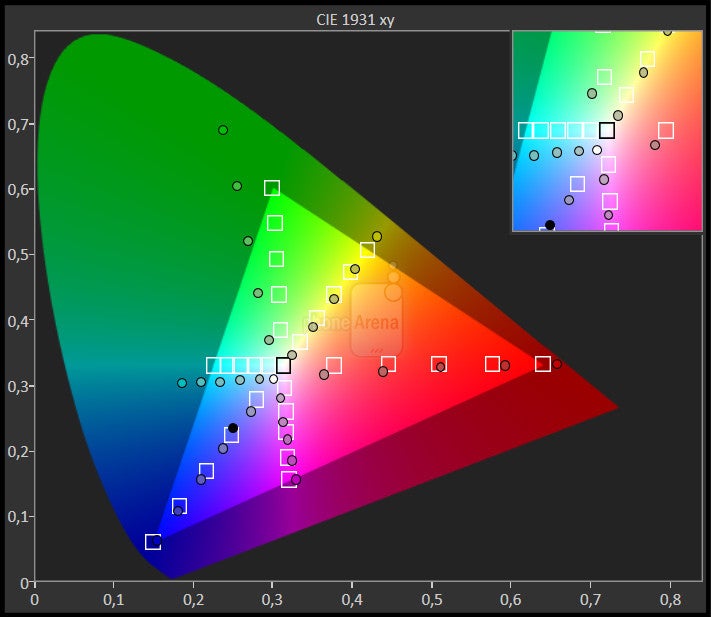
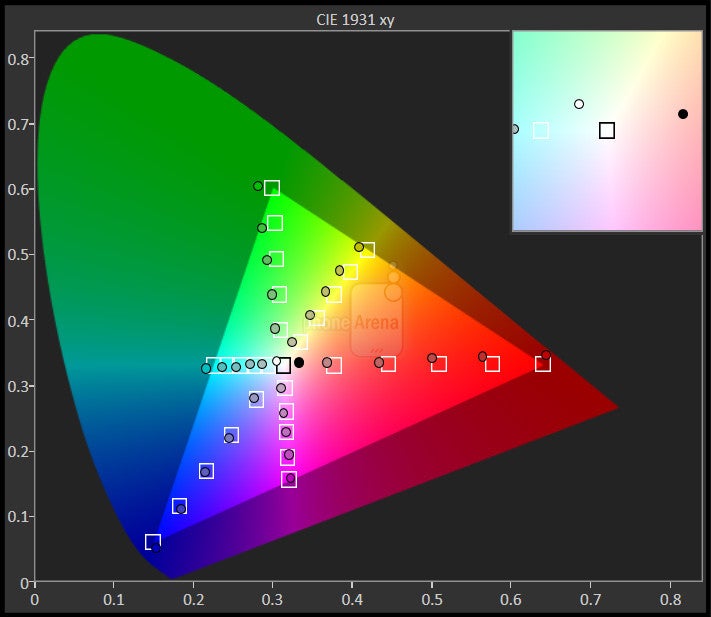
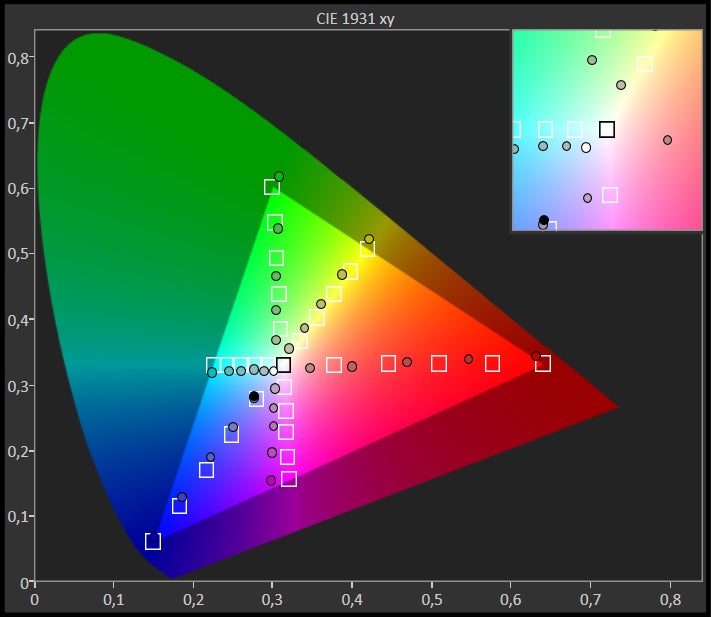
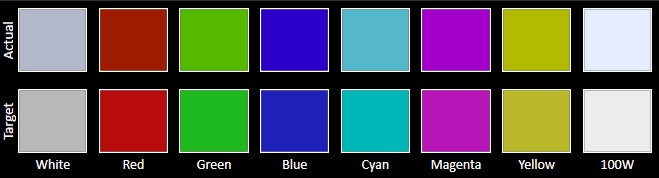
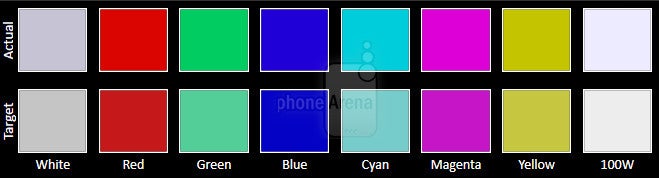
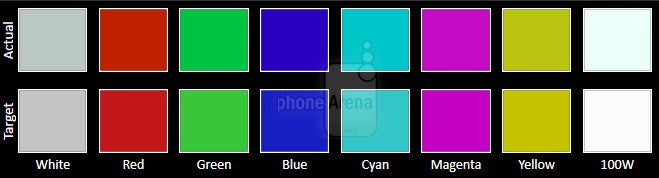
The screen isn't amazing, but most of its flaws can be forgiven.
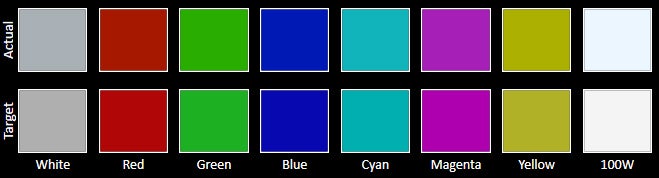
The 6.44-inch display is good, but not remarkable. It has a 1080 x 1920 resolution, which suffices, but its colors are on the colder side and appear darker than they actually are. The viewing angles are solid, but the display left us squinting badly to make out something on a relaxed sunny day, despite its strong brightness output. Overall, the display quality is acceptable, but not exemplary. After all, you get what you pay for, and in this case, the Mi Max's screen is right on the money.


Interface and Functionality
From China with love, obscure apps, and a distinct lack of Google.
Performance
The phablet performs superbly for the price, although those heavy 3D games might stutter.
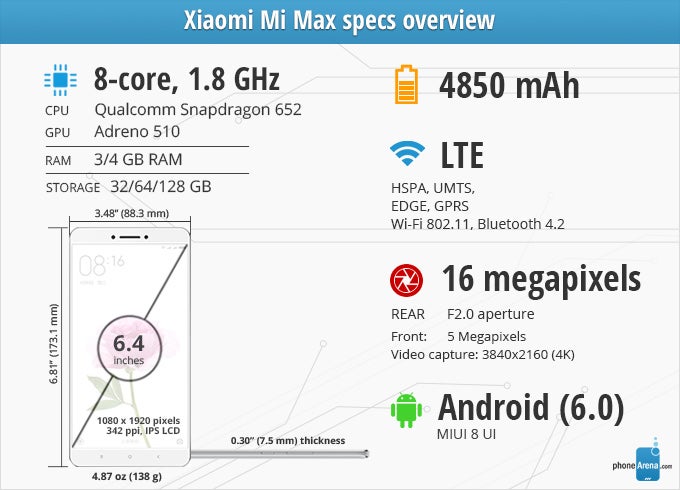
Powered by Qualcomm's upper mid-range Snapdragon 652 processor and outfitted with 3GB of RAM, the Mi Max can handle everything but the most demanding 3D games. If that's not a problem, you will get to enjoy fast performance in everyday usage, near-instant fingerprint unlocking, and speedy browsing. The octa-core 1.8GHz CPU and Adreno 510 GPU are certainly put to good work here. Also, the phablet comes with up to 128GB of expandable internal storage, but the 32GB and 64GB models (we tested the latter) ought to handle almost everyone's needs.
Connectivity
No compromises with network support, but global LTE bands might be in question.
With its modern Qualcomm modem, the Mi Max theoretically supports download speeds of up to 300Mbps and upload speeds of up to 100Mbps. Additional features like LTE Dual SIM, HD Voice over 3G, and Wi-Fi calling also make the cut. The Mi Max is a dual-SIM handset, although opting to use a microSD card will fill one of the available SIM card slots. You'll also get Bluetooth 4.1, NFC, and USB 2.0. Mind you, though, the phone won't handle each and every LTE band across the globe, and US carrier compatibility is particularly uncertain. We advise checking with your carrier before you buy.
Camera
The 16MP camera captures lovely detail, but focus and exposure aren't always reliable.
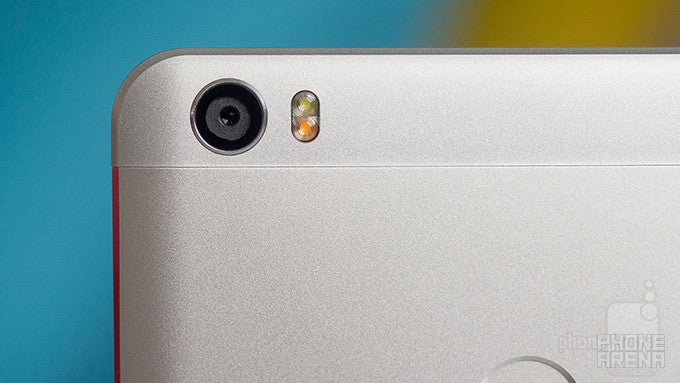
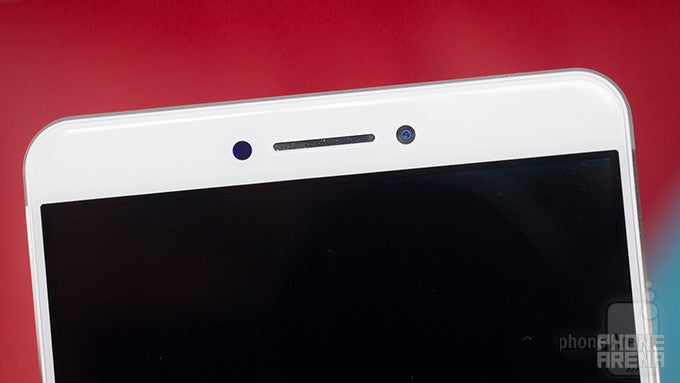
Xiaomi knows today's smartphone users love taking photos, so it equipped the Mi Max with a competent camera setup. The main unit is a 16MP Dual-LED cam with f/2.0 aperture and PDAF, while the front camera is of 5MP kin.
Still, the Mi Max captures a nice amount of detail in good light conditions, but if the light is less than stellar, the heavy-handed sharpening can make photos unpleasant to look at up close (zoom in the photos from the park). The colors are pleasantly natural, with a very subtle hint of redness to make for a warmer image.
Indoor shots are clean, although not using the flash in dark surroundings will lead to unsightly noise. Thankfully, the dual-led flash is reliable. although we have seen brighter and fuller illumination. Finally, selfies from the front cam turn out stellar, but be careful with the beauty mode, lest you end up looking like you came out of a skin lotion commercial.
Xiaomi Mi Max sample images
Video recording
The Mi Max captures video in up to 4K resolution at 30 frames per second. The image quality seems fine on the phone's display, but we couldn't play the .MP4 videos on our powerful computers no matter what. Even worse, YouTube was unable to properly convert them for uploading. The Mi Max's jumbled video encoding is a significant flaw – you can't watch videos on your PC (and possibly TV set), and you're unable to share them on the world's biggest video portal, which is ridiculous.
Audio recording is in stereo and noise reduction is subtle, which means background noise can be distracting, but at the same time, your voice doesn't sound like its coming from down under.
Call quality
Voices come through clear, but holding a phone this big next to your head will get you looks.
Voices sound legible on both sides of the conversation, and the earpiece is loud enough to let you hear calls in a noisy situation. Speaker volume is sufficiently loud, should you opt towards using that. Overall, we have no complaints, although holding a phone this big next to your ear might turn you into an entertaining sight for onlookers.
Battery life
A large battery and good optimization make for a lot of on-screen time, indeed!
With its generous 4850 battery, the Xiaomi Mi Max lasted 12 hours and 2 minutes of constant on-screen use in our test, which is an excellent result. You can also engage the battery saver feature in dire moments, squeezing even more juice of that big ol' cell. The handset supports Qualcomm's Quick Charging standards (both 2.0 and 3.0), but you will have to buy a special charger to take advantage of that. The bundled one takes over three hours to fill up, but this has more to do with the large battery than the accessory itself.
Conclusion
Alas, the Mi Max is not exactly a compelling purchase for customers outside of Asia. The phablet may not work reliably enough with some 3G and 4G networks. It also won't be serviced and supported in the majority of the world. Videos shot with it are unplayable on modern computers, which is a bit ridiculous. And considering you'll have to pay a price premium, in addition to shipping costs and taxes, the Mi Max makes for a potentially troublesome buy for most consumers other than the more tech-savvy ones out there.
Follow us on Google News


Things that are NOT allowed:
To help keep our community safe and free from spam, we apply temporary limits to newly created accounts: