Every product we review or recommend is thoroughly tested by our in-house experts in real-world conditions, following our
review methodology
and
ethics statement
to ensure honest, independent, and data-driven results.
Introduction
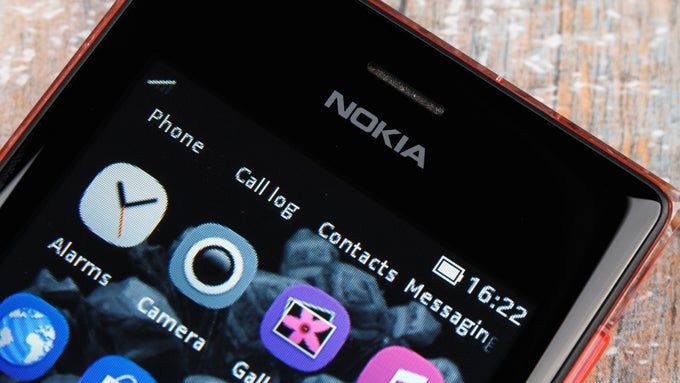
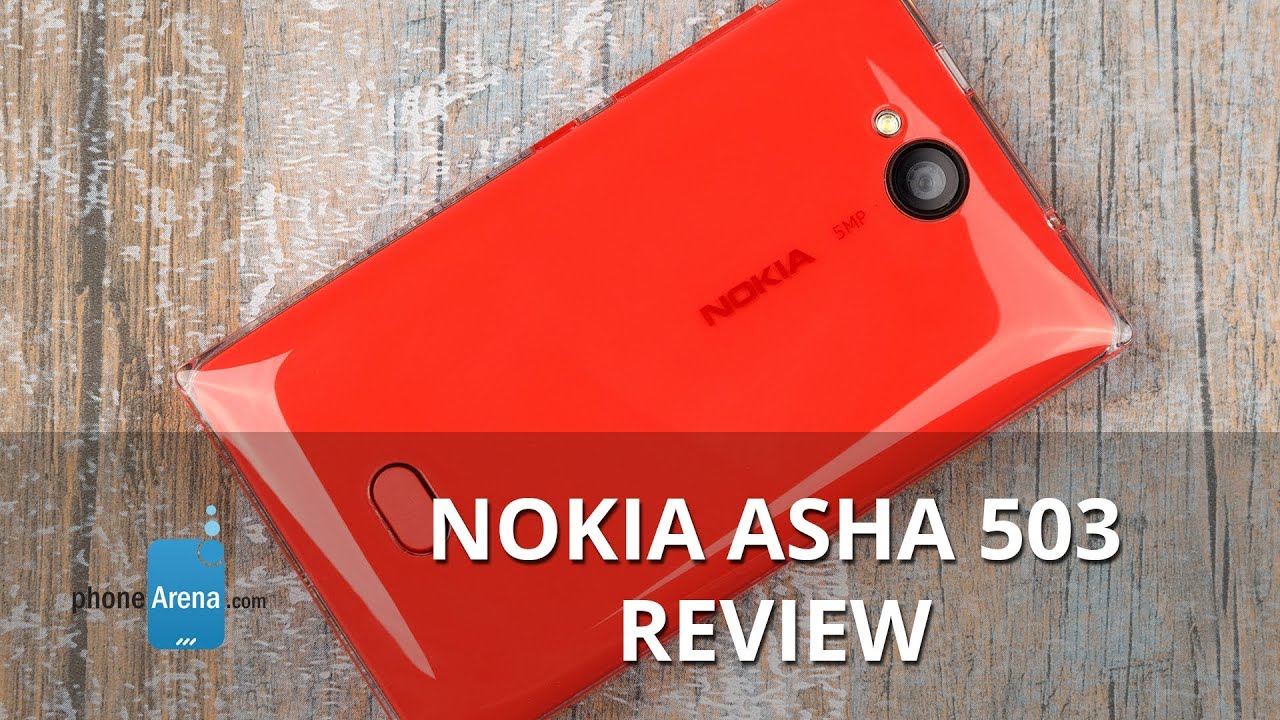
The Nokia Asha 503 is a fun little affordable feature phone coming in vibrant colorful tones. With a unique glass-like outer coating, it appears as if it’s in a transparent glossy case and is definitely aiming for the younger crowds.
The Asha 503 comes in a dual and single SIM models (we have the single SIM version for review). It builds up on the blocky design and colors of the Asha 501, but adds in 3G connectivity, a more capable 5-megapixel camera and a bit more in performance power. Is all of that enough to justify you buying this feature phone rather than getting an affordable modern smartphone?
Let’s find out.
In the box:
Wall charger
Earbud headphones
User manual
Design
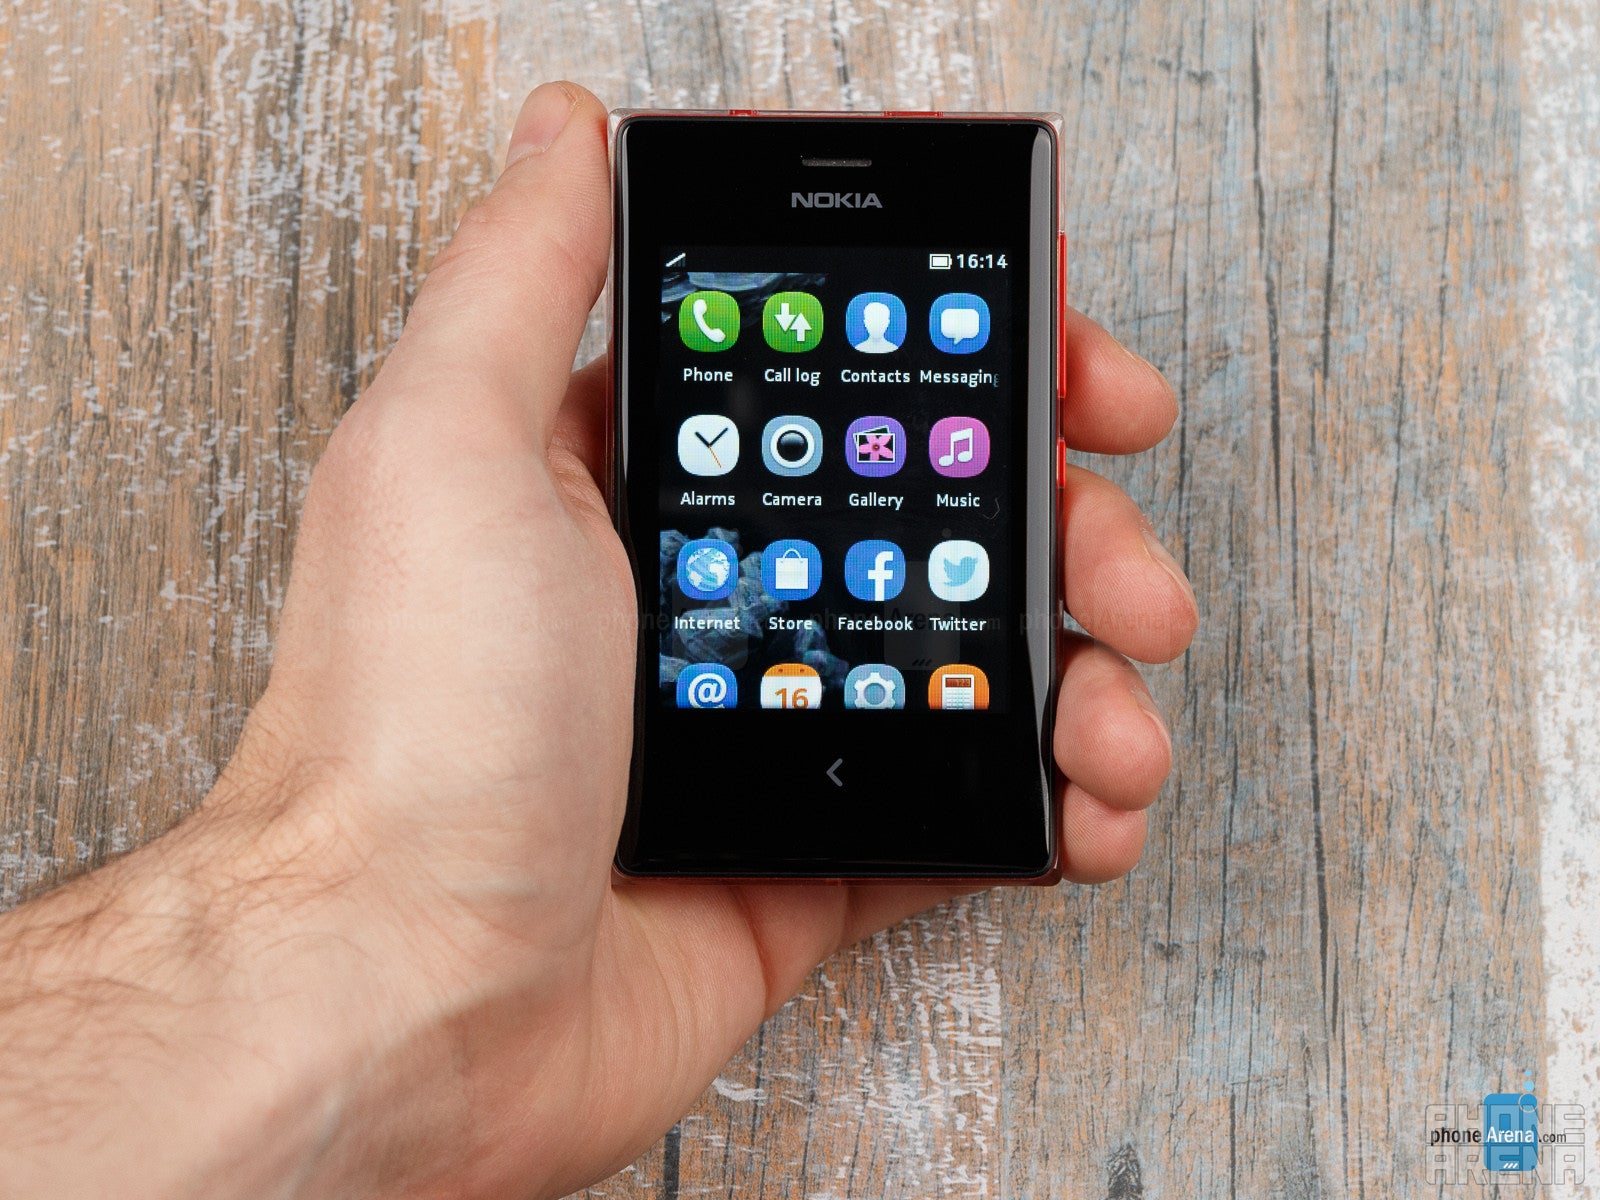
The Nokia Asha 503 has a pretty unique design - a translucent glass-like (it’s actually plastic) coating covers its vibrant color without hiding it. It looks a bit as if Nokia took this summer’s Asha 501 and put it in a glass case. Initially, we were surprised rather than impressed by the Asha 503 design, but overtime this hard coating grew on us and we ended up liking it for the sense of rigidity it gives the phone and just for its unique visuals. The Asha 503 comes in vivid red, yellow, green, cyan, white and black.
This new member of the Asha family is also small and compact as most of its Asha peers and while that does mean you get a smaller display, it also means that the device fits easily in pockets and is actually easy to use with a single hand. It’s a bit larger and thicker than the preceding Asha 501, but the difference is small. Truth is it’s a bit chubby, but given its compact size, this is not really much of an issue. The phone is solidly put together and it feels like you’re holding something that will withstand the test of time and elements, even though this phone is not water or dust protected in any way.
The Asha 503 features a single capacitive ‘back’ button right below the display and it works in a predictable and consistent way, bringing you back one step at a time. All other navigation in Asha’s interface happens conveniently via swipes, but more on that later.
Recommended For You
The handset also features a very clicky and easy to press lock key and volume rocker, fittingly positioned on the right. There’s also a microUSB port and 3.5mm headset jack on top.
The Asha 503 features a 3-inch capacitive LCD display (covered with protective Gorilla Glass) supporting 262 thousand colors and not the 16 million we’re used to seeing on most smartphones nowadays. This makes color transitions less smooth and with a very low resolution of 240 x 320 pixels, images look pixelized, not sharp.
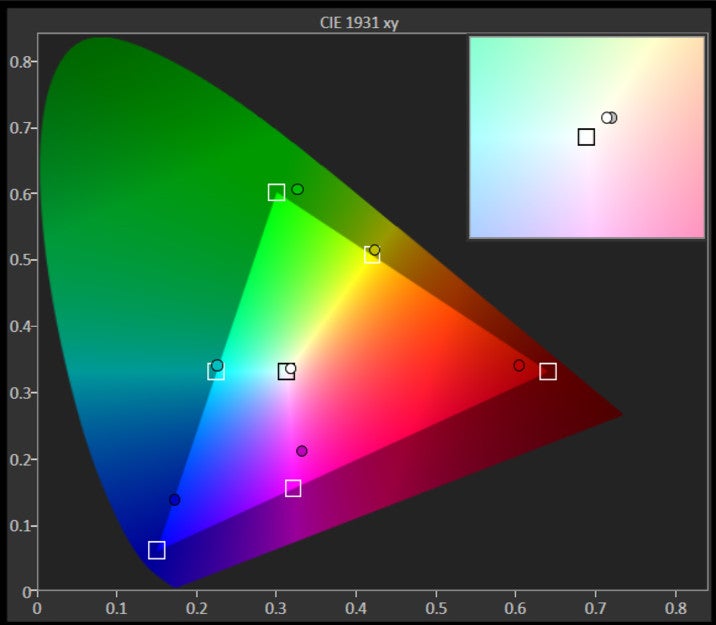
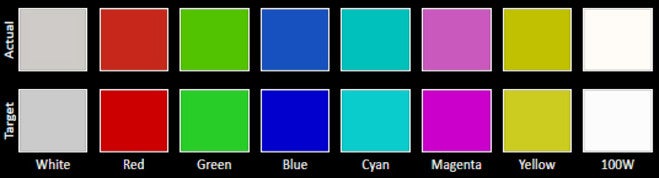
It does not make much sense speaking about color accuracy for such an affordable device, but we still ran our tests only to prove what we suspected - colors are way off in many occasions with a noticeable blueish tint. Brightness is also way below the average and that makes the screen hard to read outdoors. Viewing angles are also poor and the image washes out significantly at an angle and nearly completely at more extreme angles. Despite all the price considerations, we were underwhelmed by the screen of the Asha 503.
The numbers below represent the amount of deviation in the respective property,observed when a display is viewed from a 45-degree angle as opposed to direct viewing.
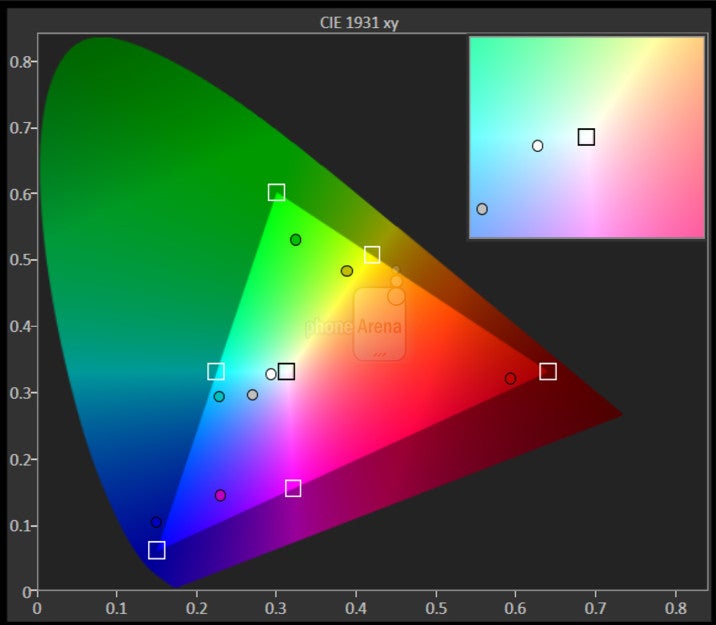
The CIE 1931 xy color gamut chart represents the set(area)of colors that a display can reproduce,with the sRGB colorspace(the highlighted triangle)serving as reference.The chart also provides a visual representation of a display's color accuracy. The small squares across the boundaries of the triangle are the reference points for the various colors, while the small dots are the actual measurements. Ideally, each dot should be positioned on top of its respective square. The 'x:CIE31' and 'y:CIE31' values in the table below the chart indicate the position of each measurement on the chart. 'Y' shows the luminance (in nits) of each measured color, while 'Target Y' is the desired luminance level for that color. Finally, 'ΔE 2000' is the Delta E value of the measured color. Delta E values of below 2 are ideal.
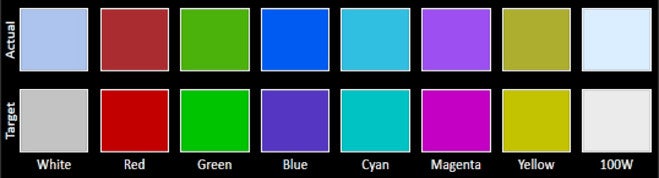
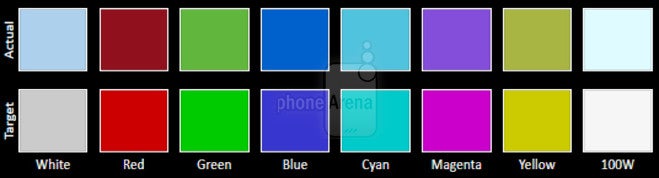
The Color accuracy chart gives an idea of how close a display's measured colors are to their referential values. The first line holds the measured (actual) colors, while the second line holds the reference (target) colors. The closer the actual colors are to the target ones, the better.
The Grayscale accuracy chart shows whether a display has a correct white balance(balance between red,green and blue)across different levels of grey(from dark to bright).The closer the Actual colors are to the Target ones,the better.
The Asha 503 features the new Asha software platform, a much improved and modernized version of the Series 40 feature phone system, and it comes with a hugely swipe-dominated interface borrowed from the now cancelled MeeGo operating system.
Let’s first make it clear - Nokia is calling these Asha devices “smartphones”, but the operating system is so basic, that we really believe it is more fair to refer to them as “feature phones”. Although they have “apps”, their quality and functionality is not on par with basic smartphones running on Android or Windows Phone OS. Instead of full-fledged apps, you get very basic ones that are hugely limited - you might find titles like Plants vs Zombies on the Asha 503, but it’s nothing like the original title we know and love. The only similarity is the name.
The list of included apps features a built-in mail, gallery, music, Internet browser, calendar and basic Facebook and Twitter applications. Another great news is that WhatsApp, the popular IM client, is now available on Asha. Nokia offers a free HERE Maps app as an optional download. It’s a nice touch as it comes with navigational directions and a nice search, but still it’s a bit on the slow side and falls short when compared to similar solutions on smartphones. We should note that the Asha 503 lacks GPS, so positioning is not as accurate, depending on the cellular towers.
Swipe gestures are used to navigate around the new ‘Fastlane’ interface. It consists of two panels: an app drawer and a vertically scrolling list of recently opened apps. Going back to that 2-panel home setup happens via a swipe to the left or right that works in any app. You get used to it very quickly and it’s actually pretty convenient. Swiping from the top brings a notification dropdown with quick toggles for switching between oft used settings like Wi-Fi connectivity and Bluetooth. Finally, there is a contextual swipe from the bottom that works in most apps and brings all relevant options for that particular application. From the lock screen, a swipe from the bottom conveniently fires up the camera.
For improved battery savings, Nokia uses its ‘Glance screen’ feature so you can see the time straight from the lockscreen, without having to unlock the phone and fire up the energy-hungry display.
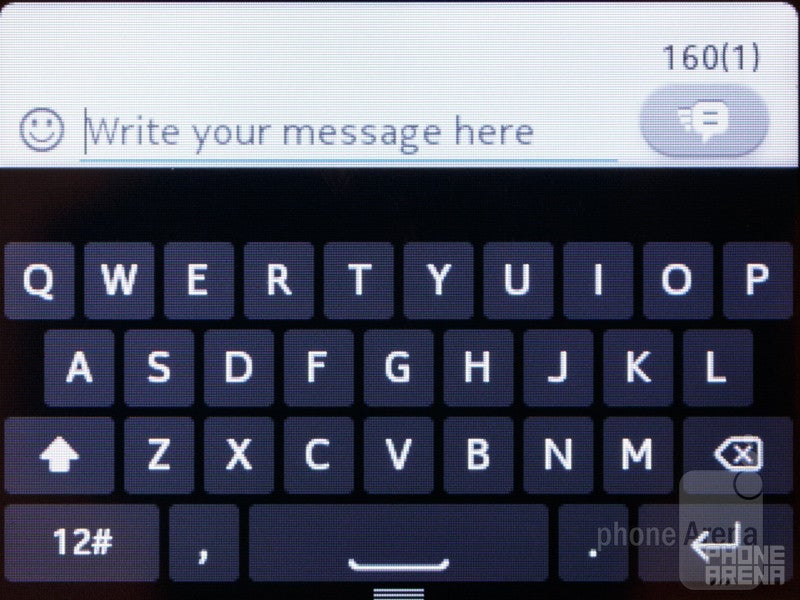
Despite being a tiny device, the 3-inch Asha 503 has a very snappy and convenient on screen keyboard that we typed on surprisingly accurately. It’s a full QWERTY keyboard, even in portrait mode, and it’s a joy for texters.
Processor and Memory
The Asha 503 looks like a hugely underpowered device compared to even the cheapest smartphones. Unfortunately, even though the Asha software platform is optimized for such devices, it still feels slow. Navigating around the menu is mostly smooth (but was it for poor screen optimizations or something else, it skips frames and looks choppy), but when opening apps or trying to open images, the slowdown is very noticeable.
Speaking of actual hardware, Nokia does not release any details about the processor, but all chances are we’re looking at a 1GHz single-core ARM11-based processor. The Asha 503 features 128MB of RAM, double what the Asha 501 had, but four times less than most Android competitors at its price point.
There’s no point in discussing gaming on this device. It only supports very basic Java games with a maximum size of 5MB - way too insufficient for a quality gaming experience. There are still some decent titles to kill time though.
The handset comes with around 170MB of user-available internal storage which is a very small allowance. Luckily, it can be expanded via microSD cards of up to 32 gigs, and the phone ships with a 4GB card in the box.
Internet and Connectivity
Ashe 503 supports Wi-Fi and Bluetooth, but there is no GPS. Good news is that it finally brings 3G connectivity to the series. The Asha 501 was limited to 2G, so the jump to 3G with 7.2Mbps downlink speeds is much appreciated. It sounds better on paper than it works in real life, though. The limited functionality of a feature phone combined with the small and not all that responsive screen, makes it hard to put those faster speeds to good use.
To access the web you have the Nokia Xpress browser. It is usable, but not fast nor very enjoyable. The browser cannot render webpages properly and formatting is often broken. Zooming in doesn't have different levels and allows only for fully zoomed out or up-close look. Scrolling around most webpages (especially those that are not optimized for mobile) happens with an annoying delay. Text is also hard to read with such low resolution. All in all, while you can use the Asha 503 to access the web, the slow and frustrating browser is likely to convince you to do this when you need to, not when you want to.
Camera
The Asha 503 comes with a 5-megapixel rear fixed-focus camera and there is no front facing camera. We actually like the camera interface - it’s a bit slow to open, but is neatly optimized. Swiping changes shooting modes from image stills to video to the gallery. A long tap brings up a menu where you can tweak flash settings, timer, add effects, select camera sounds and pick a resolution. Finer settings are not available, though.
The image quality is okay for the class. Colors are mostly natural and pleasing, and this is enough to get us content given the price. Having a fixed focus camera comes with the disadvantage of not being able to shoot macro.
Video is disappointing, though. By default, the phone captures 480 x 320 pixel footage, but you can bump that up to 640 x 480 pixels. Still, detail is mediocre, and it doesn't help that the video is skippy, with a poor framerate of 17fps (up to 21 fps at lower resolutions). Moreover, recordings come with an annoying almost constant crackling sound.
Multimedia
Despite being a tiny 3” phone, the Asha 503 could still be used to play back video and we were pleasantly surprised that it supported all common formats and video codecs right out the gate. We played back files at the native 240 x 320 pixel resolution, and there was no stutter.
With a microSD card and a basic music player, you can definitely load up your music collection and listen on the go. We like the fact that headphones are bundled in the box and that they match the color of the phone, but the sound quality is nothing to write home about as music sounds very tinny, lacking any depth.
The image gallery is a very basic app that has no integration with social services. Unfortunately, it is very slow to load images, even those 5MP shots that you shot on this handset.
Call Quality
We are fairly happy with call quality on the Asha 503. It features a single microphone, but our callers reported it sounding clear enough and loud, and could easily recognize the natural tone of our voice. On our end of the line, in the earpiece, voices are a bit too quiet - not so much for this to be a problem indoors, but talking outside in a busy spot or for those working at loud construction sites for instance it might be an issue.
Battery life
The Asha 503 comes with a 1200mAh battery, but while the size has not changed from the preceding Asha 501, the actual longevity has actually dropped down a bit to the average 12 hours on 2G, and the low 4.5 hours on 3G.
A feature phone is something that most people would use less often and with an excellent stand-by time, this translates into a perception of great battery life. In our few days with the phone, we averaged nearly three days between charges, which is still sufficiently more than what we get on most smartphones. Battery life is one of the very few cases where feature phones make sense.
Conclusion
With a price of around $99 (€99 in Europe), the Asha 503 is without a doubt an affordable device, but in this day and age there are plenty of smartphones offering much more for the same price.
The Asha 503 is coming to affordable markets where it will meet fierce rivalry by affordable Android devices from both well-established manufacturers and new Chinese phone companies that now sell phones in mainstream outlets. The Samsung Galaxy Star S5282 looks like a much better all-around solution, offered for the same price, yet packing a contemporary Android 4.1 Jelly Bean operating system and four times more RAM. The real competition, though, comes from China with devices like the Huawei Y300 with its larger 4” WVGA screen, dual-core processor, dual SIM connectivity and Android 4.1 on board.
We like the colorful design and unique style of the Asha 503, and it has a decent 5-megapixel camera, but there is a huge mismatch between its price and functionality that we simply cannot overlook. A phone of this caliber should cost much less in this day and age. The Asha 503 will appeal to die-hard Nokia fans and people who for some reason do not want a smartphone. For all else, there are much better options out there.
Pros
Colorful fun design
Decent 5-megapixel camera
Cons
Underpowered feature phone with very limited functionality and poor apps
Victor, a seasoned mobile technology expert, has spent over a decade at PhoneArena, exploring the depths of mobile photography and reviewing hundreds of smartphones across Android and iOS ecosystems. His passion for technology, coupled with his extensive knowledge of smartphone cameras and battery life, has positioned him as a leading voice in the mobile tech industry.
A discussion is a place, where people can voice their opinion, no matter if it
is positive, neutral or negative. However, when posting, one must stay true to the topic, and not just share some
random thoughts, which are not directly related to the matter.
Things that are NOT allowed:
Off-topic talk - you must stick to the subject of discussion
Offensive, hate speech - if you want to say something, say it politely
Spam/Advertisements - these posts are deleted
Multiple accounts - one person can have only one account
Impersonations and offensive nicknames - these accounts get banned
To help keep our community safe and free from spam, we apply temporary limits to newly created accounts:
New accounts created within the last 24 hours may experience restrictions on how frequently they can
post or comment.
These limits are in place as a precaution and will automatically lift.
Moderation is done by humans. We try to be as objective as possible and moderate with zero bias. If you think a
post should be moderated - please, report it.
Have a question about the rules or why you have been moderated/limited/banned? Please,
contact us.


![T-Mobile is down for many users across the nation right now [UPDATED]](https://m-cdn.phonearena.com/images/article/181747-wide-two_350/T-Mobile-is-down-for-many-users-across-the-nation-right-now-UPDATED.webp)


Things that are NOT allowed:
To help keep our community safe and free from spam, we apply temporary limits to newly created accounts: