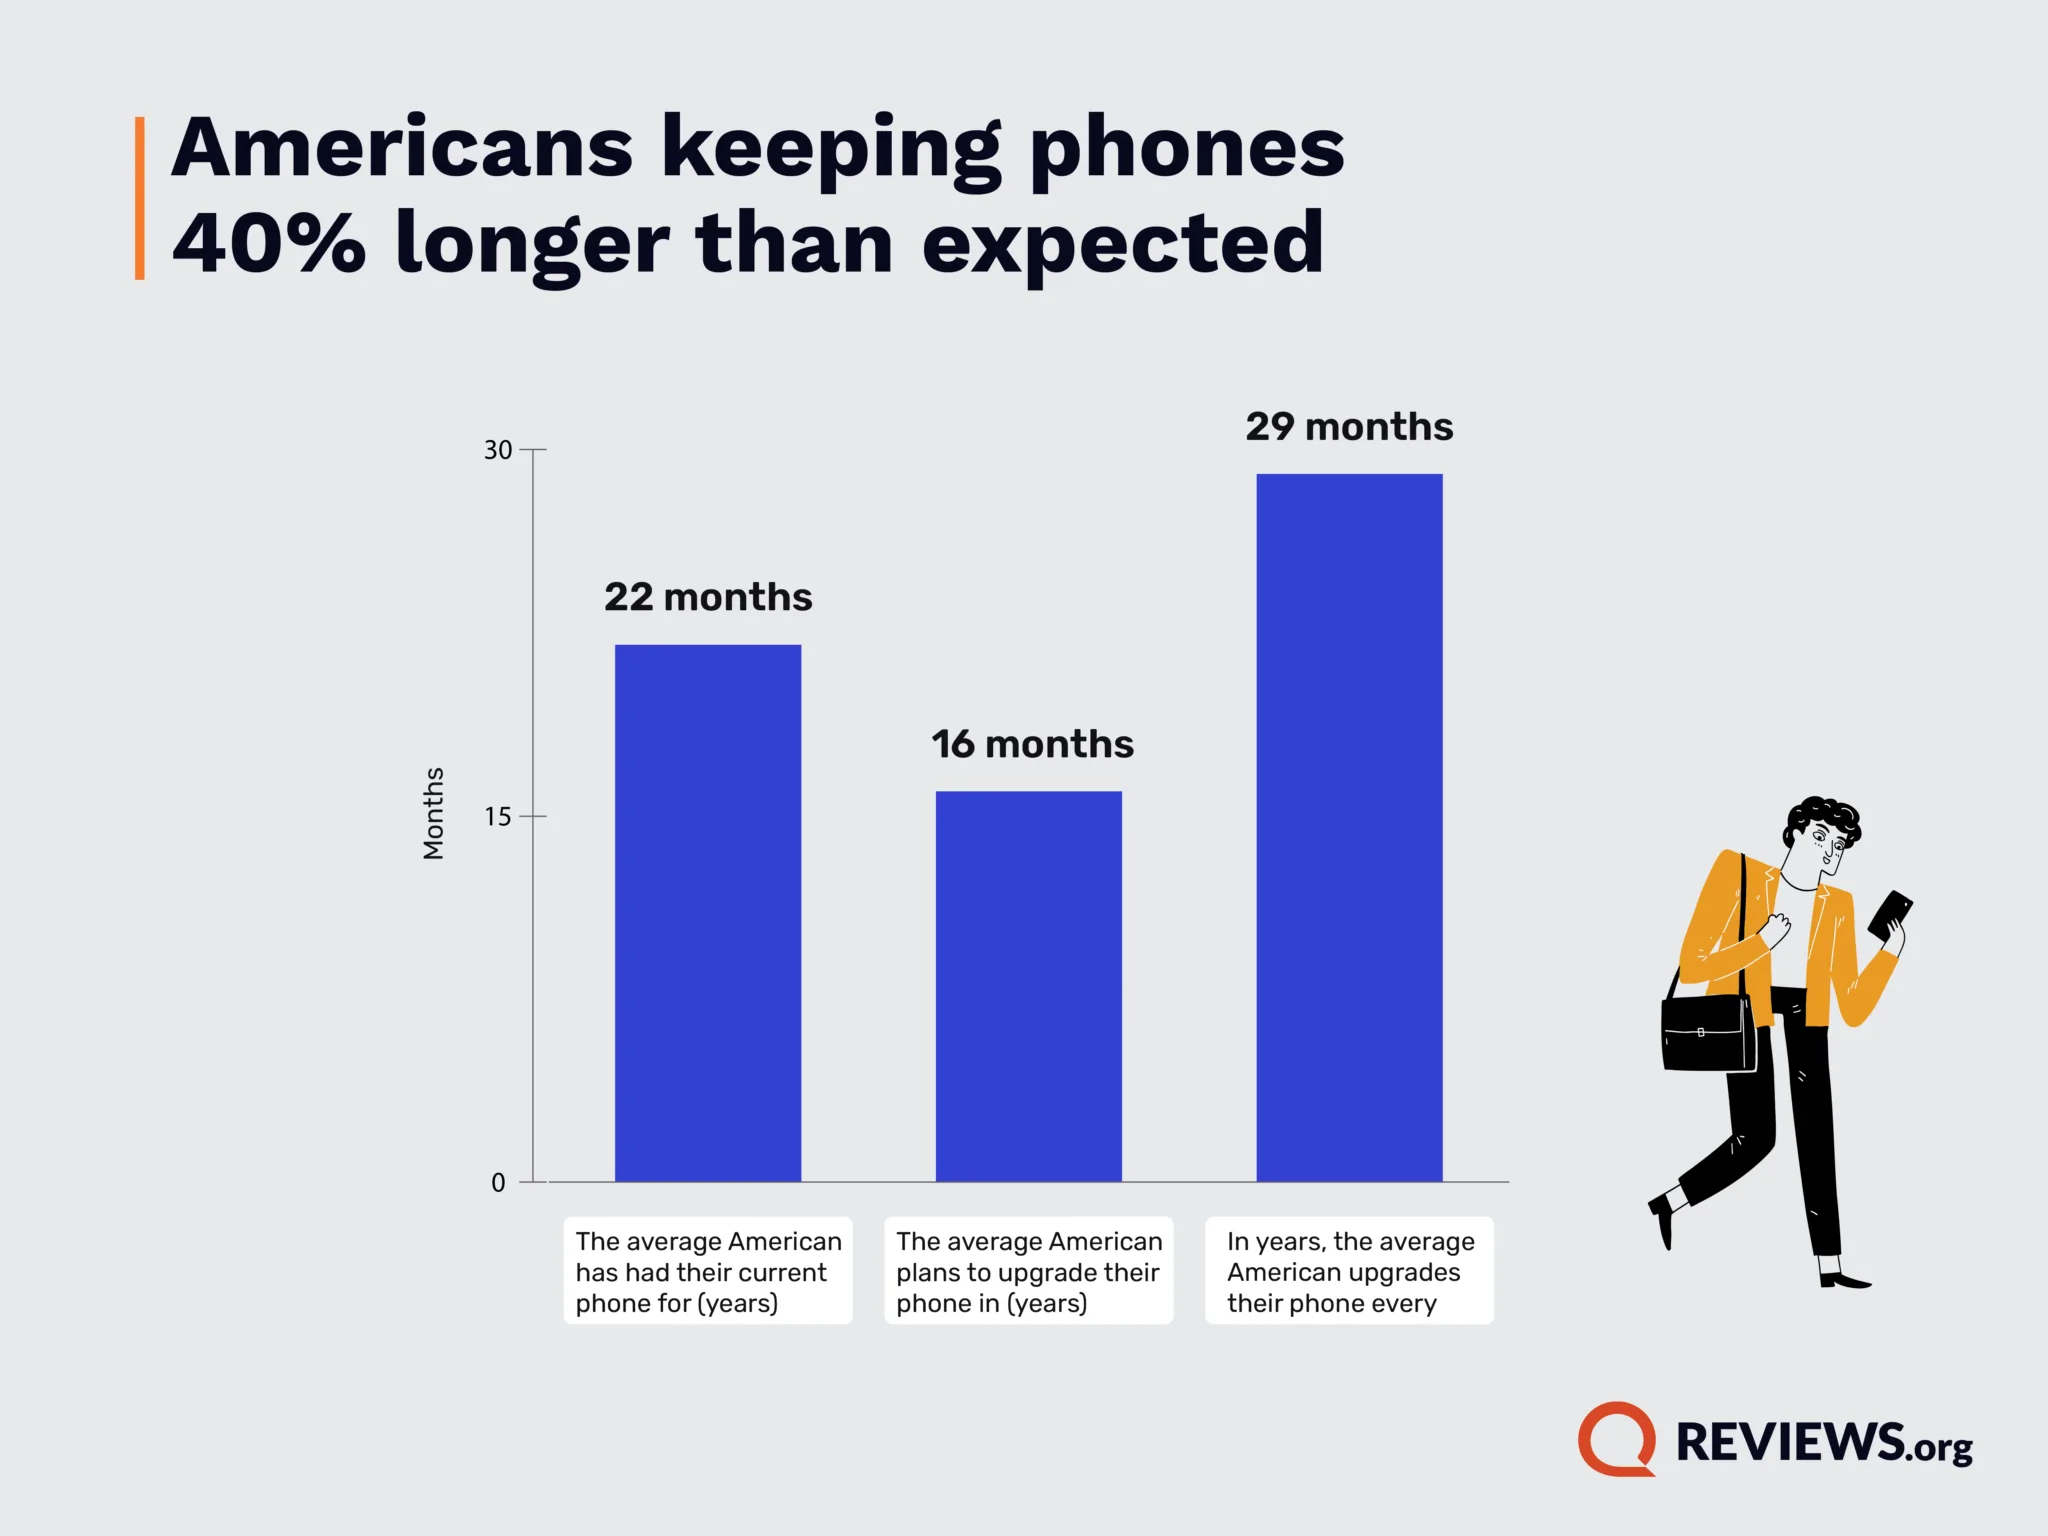
An interesting report has been published, and it shows that Americans are holding on to their phones 40% longer than they expect to. Reviews.org surveyed 1,000 adult Americans and found that the average American keeps his or her phone for close to two years and five months. The average user responding to the survey has had his/her current phone for 22 months.
While these users plan to hold on to their current handsets for a total of 38 months (3 years, 2 months), the truth is that the 29 month mark is when the average American buys his/her next handset. Thus, Americans are holding om to their current phones for 40% more than they expect to.
What drives the average American smartphone owner to upgrade?
Why do American smartphone users want to buy a new phone? The top answer, listed by 21.9% of the survey's respondents, indicated that the number one reason for buying a new phone is to enjoy faster performance. Year-over-year multi-core benchmark score improvements for application processors is in the 15% to 30% range. Battery issues were next, listed by 18.4% of the respondents to the survey. New features and a lost or broken phones were the next two responses on the list cited by 13% and 12.8% of survey respondents, respectively.
You might think that many phone owners upgrade in order to have the latest model. That was the reason given to upgrade by only 7.8% of those surveyed. Other responses included:
Compatibility with new technologies-7.60%
Insufficient storage space-7.50%
Trade-in deals or better contract options-5.70%
Better camera-4.30%
Other-1.00%
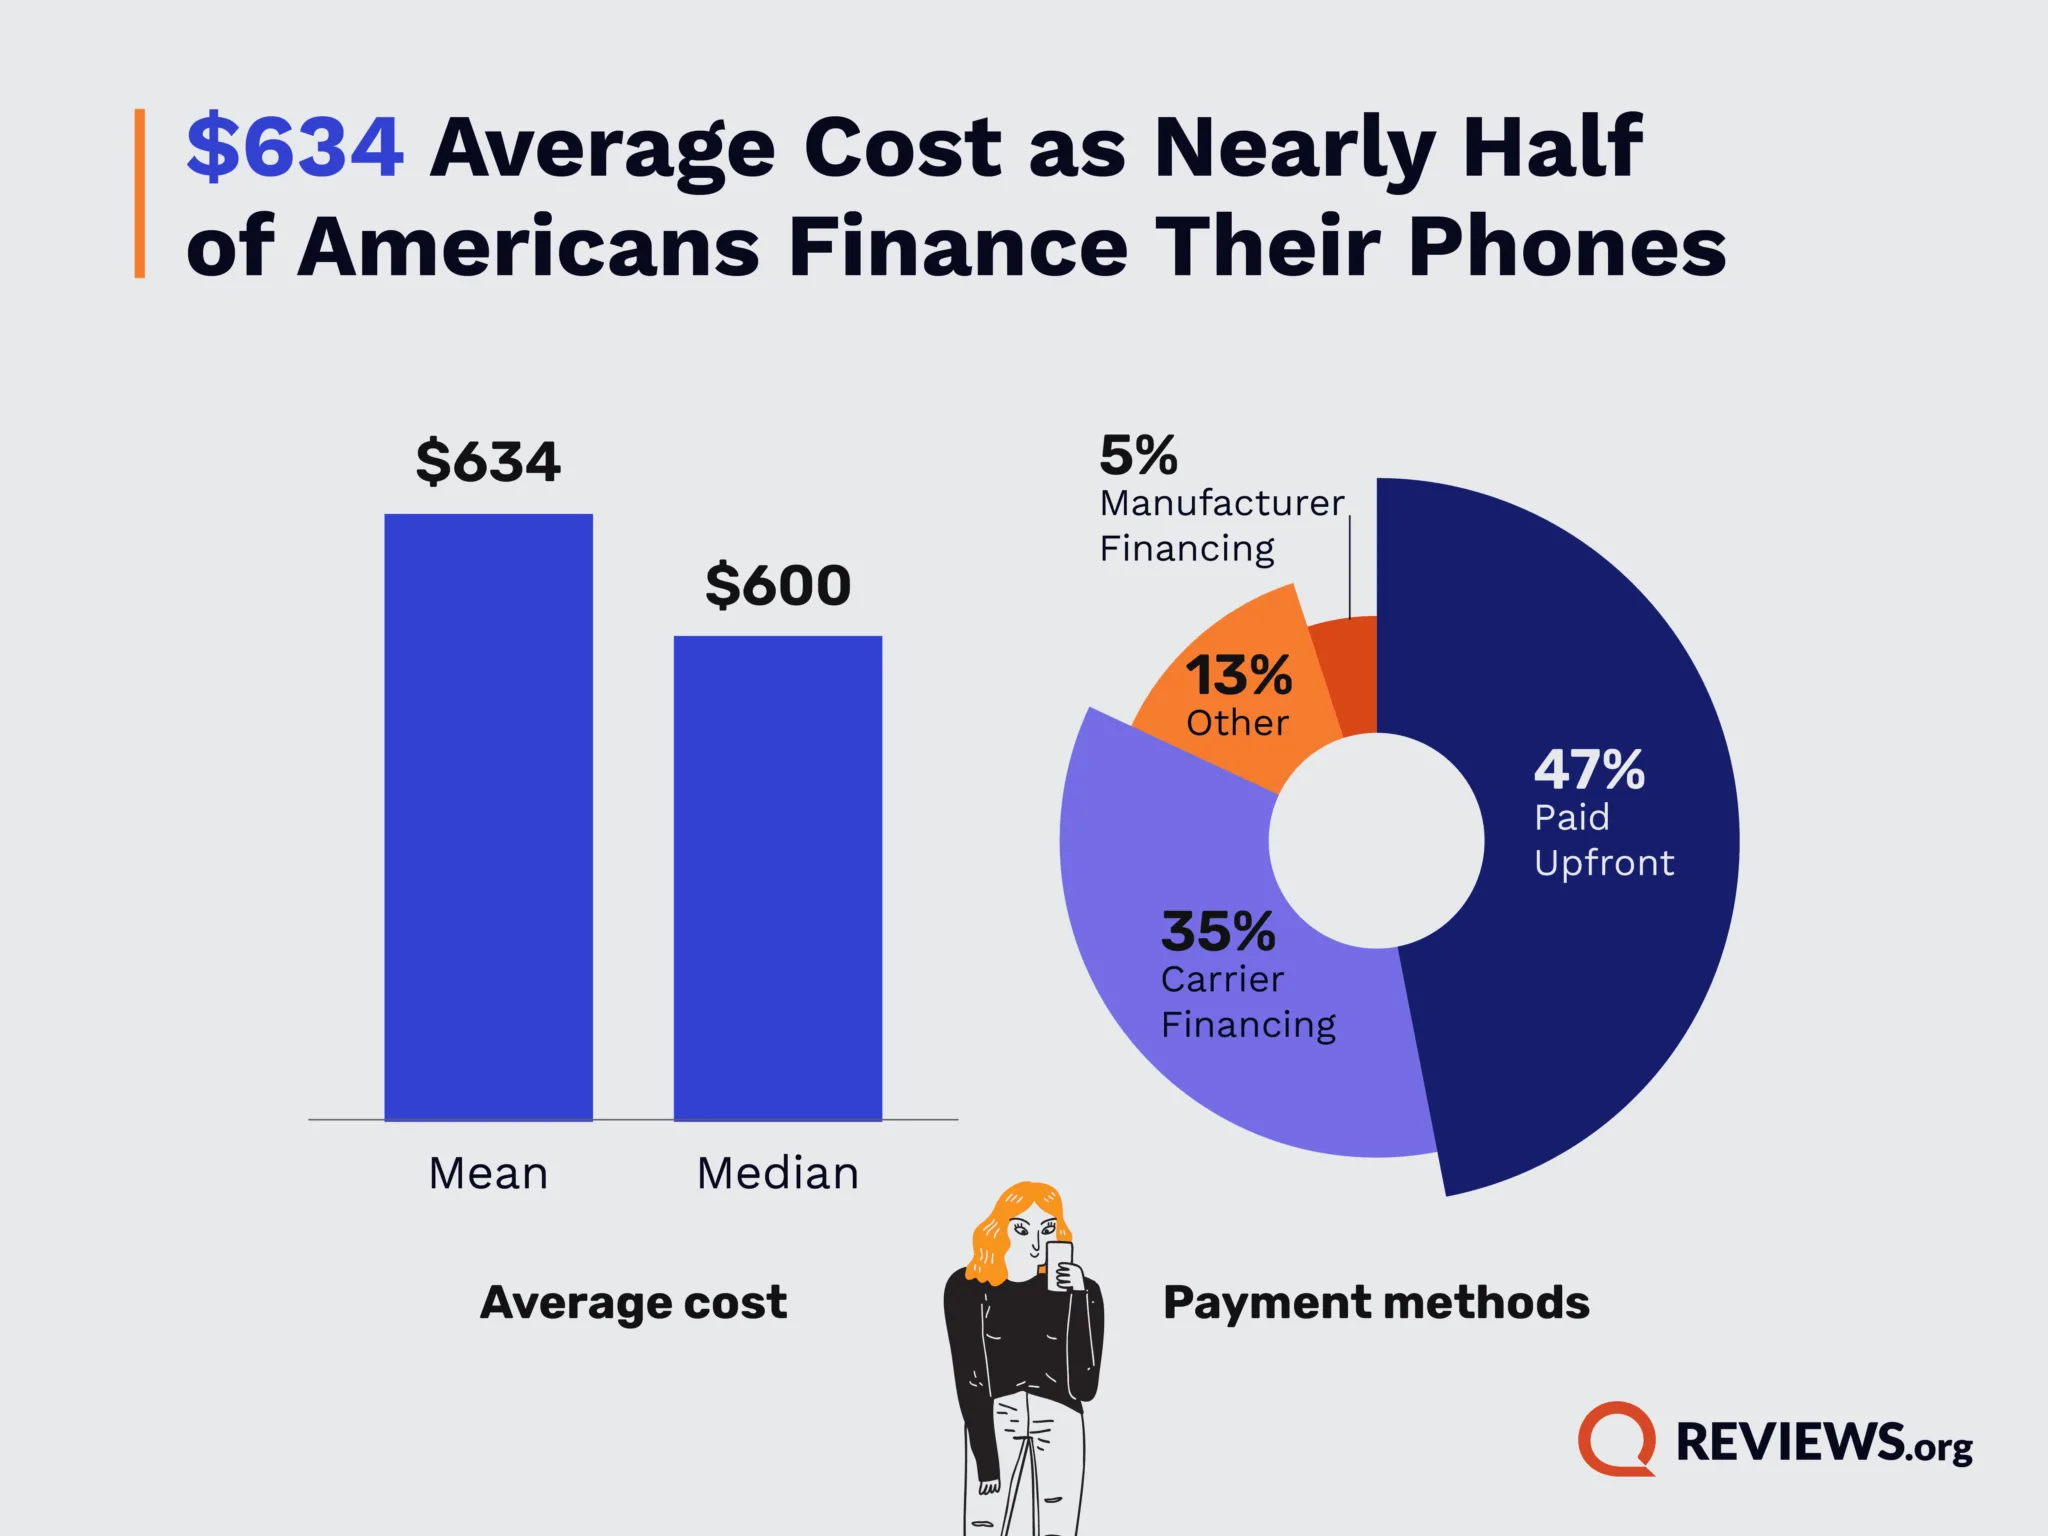
The survey discovered that the average American paid just $634 for a new phone despite prices for high-end flagships that start at $1,000 and go up. How do Americans accomplish this? Via trade-in and financing deals, of course. 35% use carrier financing, and 5% take advantage of manufacturing financing. A surprising 47% of Americans pay the entire cost of the phone upfront. One respondent to the survey, Ryan Parker, an iPhone user, traded-in his current iPhone to buy an iPhone 17 via the Apple Card. "
Recommended For You
The average cost of an American's new smartphone is $634. | Image credit-Reviews.org
Parker will now pay a reduced monthly price for his new iPhone without having to pay interest. He says, "Every year a new iPhone comes out, the value of my current phone goes down, whether I keep it in good condition or not. It's like I'm 'cashing in' on my current phone now while it's still functional and worth something, rather than risk losing all its value."
By the way, 5.10% of those surveyed were gifted their new phones, and 2.20% said they purchased a refurbished model.
A tale as old as time, iPhone versus Android
The majority of the survey's participants use an Android phone as 52.1% said that their handset runs on the Android operating system. 47.6% have an iPhone that is driven by iOS, and .30% use neither iOS nor Android. Worldwide, recent data shows that between 71.5% and 74% of phones being used are running Android. This shows how much better the iPhone is received in the U.S.
The average American holds his phone for 29 months before replacing it with a new model. | Image credit-Reviews.org
On a scale of 0 to 5 with 0 representing "Completely dissatisfied" and 5 being "“Extremely satisfied," iPhone users rated the device an average score of 4.16 compared to 3.98 for Android handsdets. Apple iPhone 15 users gave the phone a perfect 5 out of 5 while newer Samsung Galaxy models received a 3.6 out of 5. Even older iPhone models such as the iPhone 13 Pro Max (2021) and iPhone XR (2018) were rated 4.72/5 and 4.56/5, Newer Android phones were rated lower with 2023's Samsung Galaxy S23 Ultra, by comparison, given a rating of 3.58 out of 5.
Do you hold your phones for more or less than 29 months?
Less. I like to get a new phone whenever I can.
38%
More. Who could afford buying a new phone so often?
62%
100 Votes
The survey is based on the answers of 1,000 people who were questioned on September 8, 2025. According to Reviews.org, questions were asked about "information on smartphone ownership, upgrade frequency, reasons for upgrading, payment methods, and device satisfaction. Satisfaction scores were analyzed on a normalized scale of 0 to 5. Respondents were asked to refer to their phone’s screen time report to determine the average number of times per day they check their phones, in addition to how much time in total they spend on their phones per day."
The survey also revealed that the most popular iPhone model, the one owned the most by survey respondents, is the iPhone 13.
Gaming console PS5 Slim Digital edition flash sale! Limited time offer!
$644
99
$684
99
$40 off (6%)
Save $40 on PlayStation 5 Slim Digital edition from Back Market. Discount automatically applied at checkout. Offer ends 28 June 2026 at 23:59.
Alan, an ardent smartphone enthusiast and a veteran writer at PhoneArena since 2009, has witnessed and chronicled the transformative years of mobile technology. Owning iconic phones from the original iPhone to the iPhone 15 Pro Max, he has seen smartphones evolve into a global phenomenon. Beyond smartphones, Alan has covered the emergence of tablets, smartwatches, and smart speakers.
A discussion is a place, where people can voice their opinion, no matter if it
is positive, neutral or negative. However, when posting, one must stay true to the topic, and not just share some
random thoughts, which are not directly related to the matter.
Things that are NOT allowed:
Off-topic talk - you must stick to the subject of discussion
Offensive, hate speech - if you want to say something, say it politely
Spam/Advertisements - these posts are deleted
Multiple accounts - one person can have only one account
Impersonations and offensive nicknames - these accounts get banned
To help keep our community safe and free from spam, we apply temporary limits to newly created accounts:
New accounts created within the last 24 hours may experience restrictions on how frequently they can
post or comment.
These limits are in place as a precaution and will automatically lift.
Moderation is done by humans. We try to be as objective as possible and moderate with zero bias. If you think a
post should be moderated - please, report it.
Have a question about the rules or why you have been moderated/limited/banned? Please,
contact us.


Things that are NOT allowed:
To help keep our community safe and free from spam, we apply temporary limits to newly created accounts: