
Apple's mobility data helps oil traders spill red ink
Oil traders make investment decisions based on various inputs. Some use charts to predict future price moves, others look at supply and demand data, and in the 1920s some traders actually thought that the dialogue bubbles in comic strips revealed the future price move of stocks and commodities. New technologies brought more complex methods including the use of thermal cameras to track pipelines and storage tanks. And according to Reuters, many oil traders thought that thanks to Apple, they had discovered the "holy grail" of forecasting gasoline prices.
Oil traders find lack of a solid correlation between Apple's mobility data and the demand for gasoline
In the middle of April, Apple announced that it was releasing data from its Maps app based on the number of requests for directions made by iPhone users. This so-called mobility data was created to track the spread of COVID-19. But oil traders decided that by studying the data from Apple, they could come to some conclusions about how fast demand for gasoline and crude oil was recovering after drying up from the global pandemic.
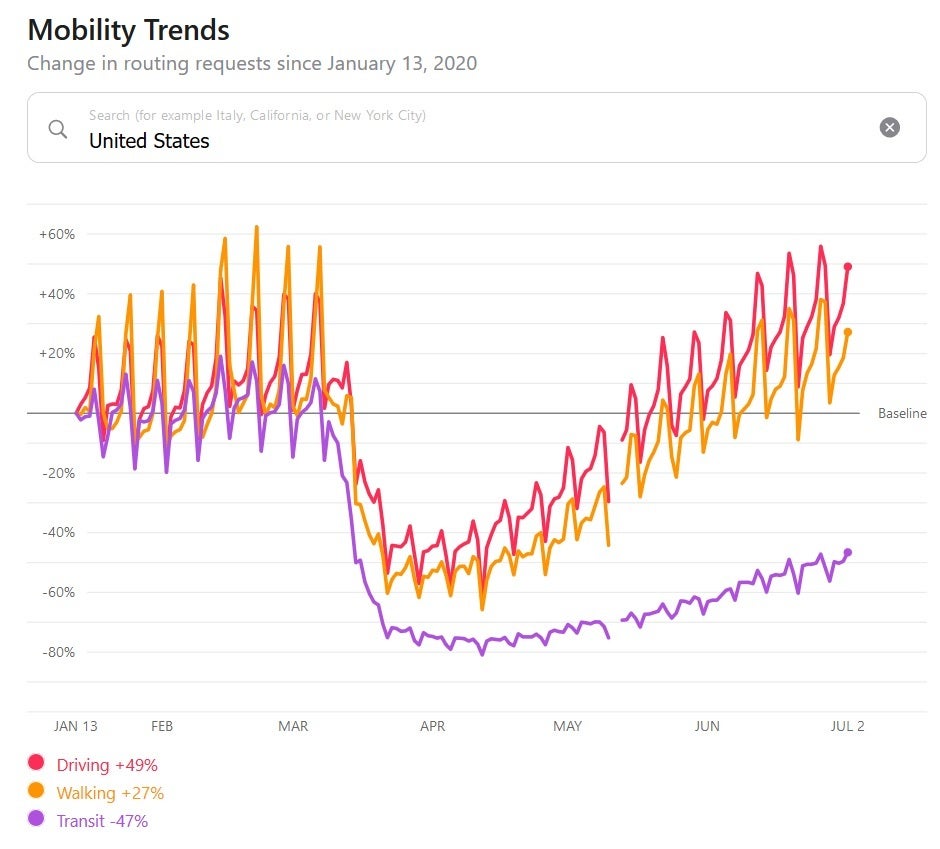
Apple's mobility data for the U.S. since the beginning of the year
Traders who used the mobility data in their trading systems were hopeful that it would provide them with useful and accurate information. But the report notes that this backfired; using the mobility data as an additional tool, traders purchased gasoline futures heading into the Memorial Day weekend back in May. The U.S. Energy Information Administration (EIA) announced that its data indicated a 6% decline in demand for gas, and futures prices declined creating red ink for many traders. Considering that 70% of the demand for oil is for vehicles, traders were upset not only because they took a hit to their accounts, but also because this exciting new tool that traders thought would tell them the future was not working.
What caused the disconnect? Some say that the problem lies with the fact that Apple's mobility data is based on search requests and not on actual miles traveled. Apple explained on its website how it calculates the data: "Using aggregated data collected from Apple Maps, the new website indicates mobility trends for major cities and 63 countries or regions. The information is generated by counting the number of requests made to Apple Maps for directions. The data sets are then compared to reflect a change in volume of people driving, walking or taking public transit around the world. Data availability in a particular city, country, or region is subject to a number of factors, including minimum thresholds for direction requests made per day." So the information used by traders only reveals how often an iPhone user looked up directions to a location. Instead of discovering a tool that provided them with real-time demand data for oil, the traders simply saw hypothetical demand for fuel.`
Matt Sallee, managing director of investment firm Tortoise Capital Advisors, says that the data generated by Apple does not correlate to oil demand as well as other indexes do. Sallee says that he still uses Apple's mobility data but adds other data including real-time traffic congestion information from mapping firm TomTom. He also uses the Dallas Federal Reserve Bank's mobility and engagement index which tracks how far user devices travel in a day and how long they remain away from home.
TomTom's data is preferred over Apple's data by RNC analyst Michael Tran. The latter says that most people do not use apps to map out their outings. RNC uses TomTom's data along with its own in-house geolocation data. While Apple declined to comment on the Reuters report, the company claims that its data captures everyone who owns an iPhone. That works out to about 100 million people in the United States alone.
With millions of dollars at stake, traders are always searching for a tool that will give them an edge.

Popular stories


Latest News


Things that are NOT allowed:
To help keep our community safe and free from spam, we apply temporary limits to newly created accounts: