
Which bands are used the most by the major U.S. wireless providers to carry data?
Ever wonder which spectrum bands belonging to the nation's four major wireless carriers are being used the most to carry data? This information has been computed by Tutela, which uses crowdsourced data to measure network traffic, and published by Fierce Wireless. The data was collected from iOS and Android devices starting on January 1st, 2018, and ending on August 31st, 2018.
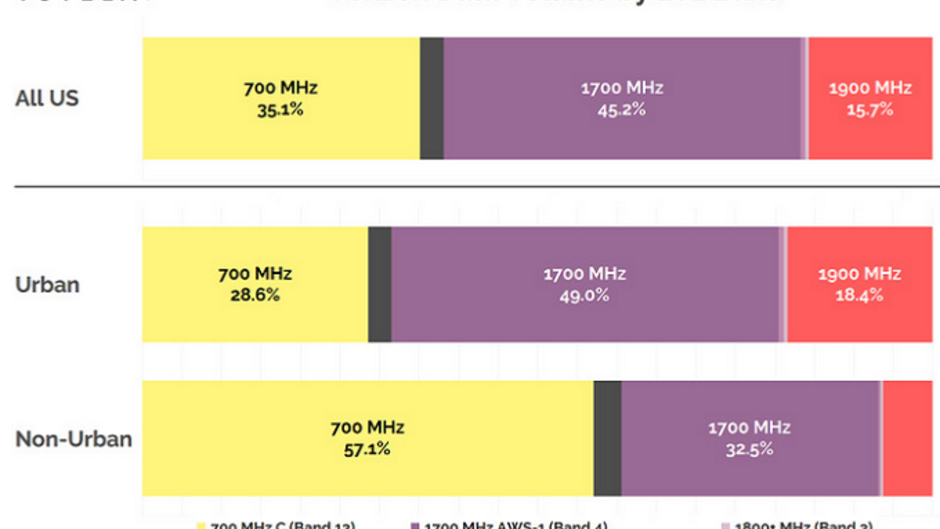
According to the data, Verizon's 1700MHz AWS spectrum (45.2%) and its 700MHz airwaves (35.1%) are carrying the bulk of the data traffic to and from Big Red customers. In rural markets, Verizon relies more on its 700MHz spectrum (57.1%) than it does throughout the rest of the country. Similarly, AT&T's 700MHz is responsible for carrying the majority of data (37.3%) outside of the city. Throughout the rest of the U.S., the carrier's 1900MHz (41.8%) does most of the work.
While we continue to hear about T-Mobile's deployment of the 600MHz low frequency spectrum that it won from an FCC auction last year, and its expanding use of 700MHz airwaves, it is both the wireless provider's 1700MHz AWS-1 (32.3%) and 1900MHz (33%) that carry most of T-Mobile's data load. Outside of the city, T-Mobile's 700MHz spectrum is more active (28%), but the 1900MHz band still does most of the heavy lifting (39.7%).
Sprint's high-frequency 1900MHz is responsible for more than half of the carrier's data traffic in the states (50.2%). In the cities, this frequency carries even more of Sprint's data traffic (53.3%). In rural areas, Sprint relies on its 1900MHz (49.9%) and its 850MHz (30.2%) airwaves.
Keep in mind that low frequency spectrum travels farther and penetrates buildings better than the high frequency variety. All four major U.S. carriers appear to use their low frequency airwaves more often in rural markets, and rely on mid and high band frequencies in urban settings.
You can check out graphs and maps based on the data by viewing the image at the top of this article, and by clicking on the slideshow below.
Which bands used by the four major carriers carry the most data?

Popular stories


Latest News


Things that are NOT allowed:
To help keep our community safe and free from spam, we apply temporary limits to newly created accounts: