Gigabyte GSmart Sierra S1 Review
Introduction
Gigabyte outed a suite of Android phones nearing the holiday shopping season, with a lot of screen sizes in the mix for various tastes. Gigabyte GSmart Sierra S1 is a dual SIM 5” HD handset with decent design and specs, arriving at a price to match. Will it be enough to be noticed amongst the ever-increasing value-for-money Android crowd? Read on to find out...
In the box
- In-ear stereo headphones
- Wall charger
- MicroUSB cable
- Warranty and information leaflets
Design
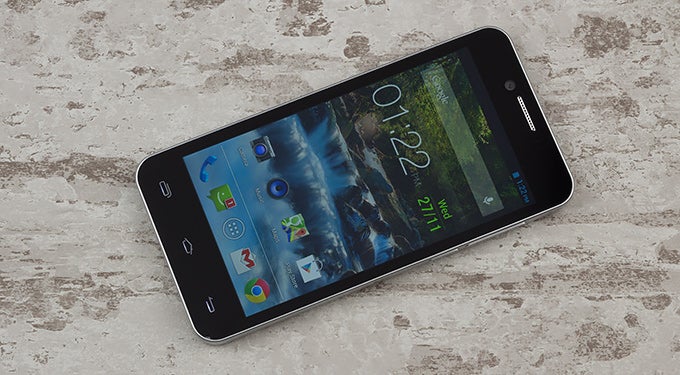
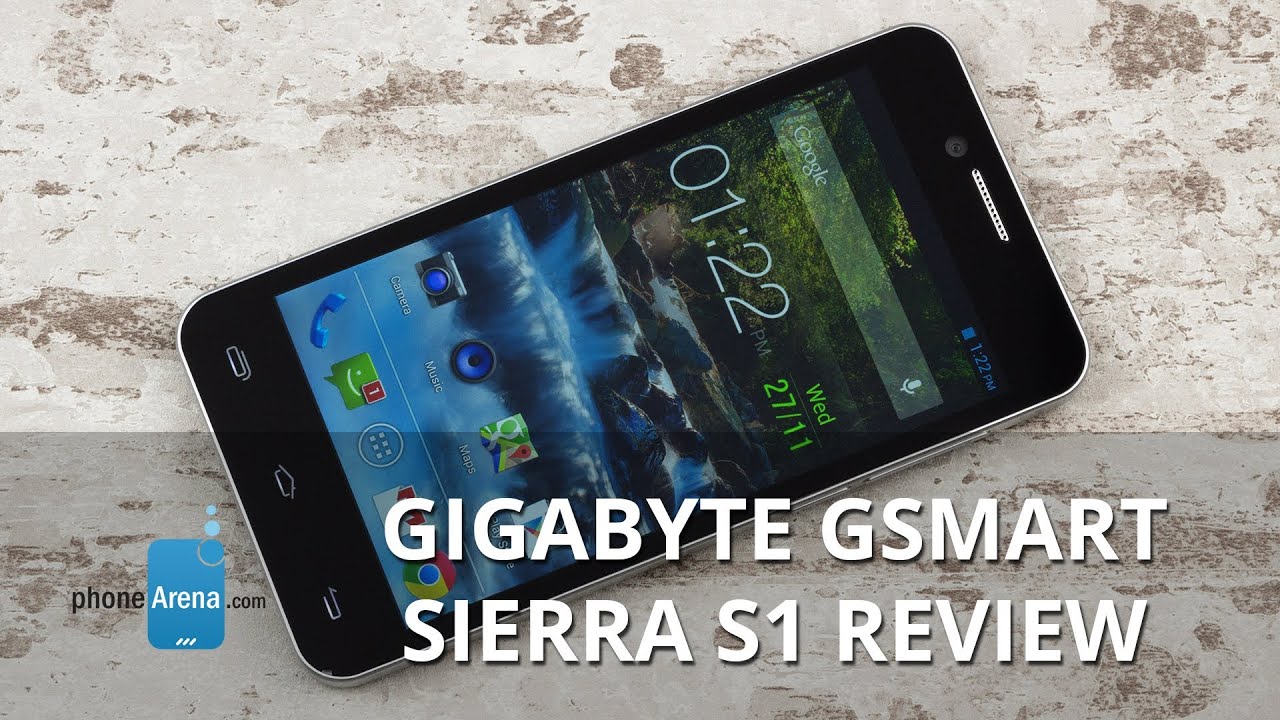
The GSmart Sierra S1 has a pretty ergonomic and pleasant to hold chassis, with soft-touch back that imitates brushed metal, and faux chrome rim surrounding the sides. Its rounded corners and tapered back make it lie firm in the hand, and the build quality is consistent, leaving the impression for quite a durable handset. At 5.73 x 2.85 x 0.35 inches (145.5 x 72.5 x 8.9 mm) and 5.93 oz (168 g) it is not the thinnest and especially the lightest 5-incher out there, but it's precisely those numbers that give it the solid feel.
The power/lock key plus volume rocker on the right are very conveniently located, with good tactile feedback, easy to feel and press without looking. The Sierra S1 has a removable back cover that fits tight yet is not hard to pry open, revealing the swappable battery, microSD card slot and two regular SIM card slots.
Display
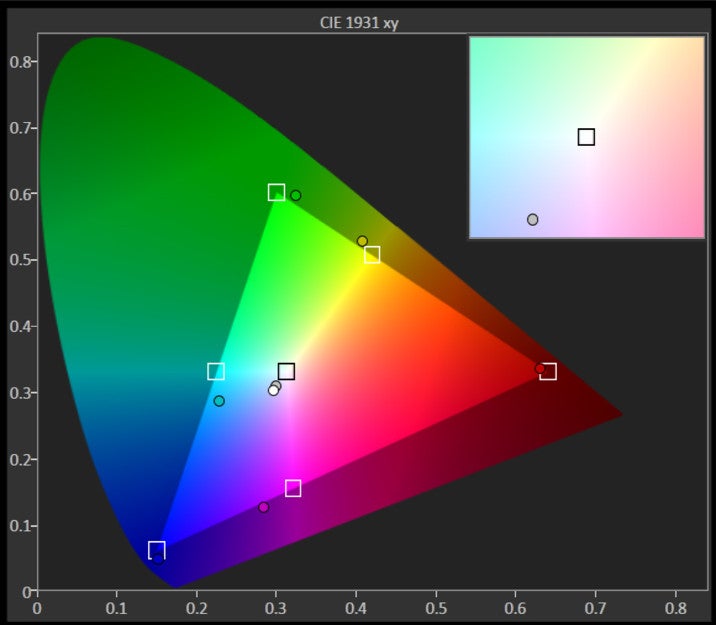
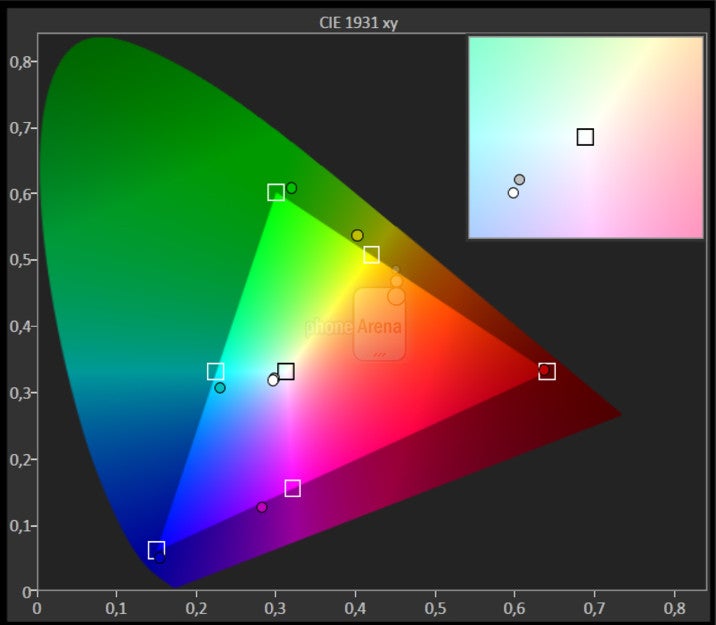
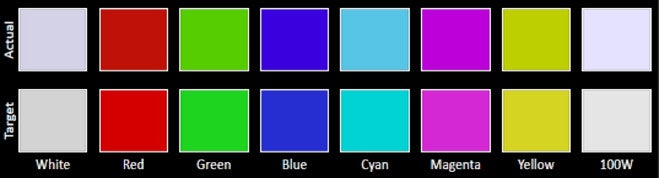
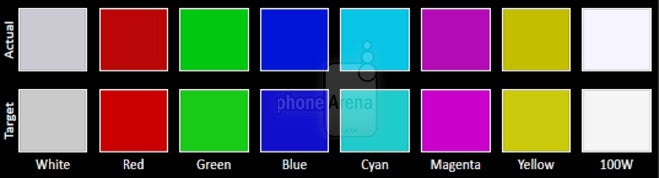
A 5” 720x1280 pixels IPS-LCD display is gracing the Sierra S1, with pretty good 294ppi pixel density, that won't leave you longing for much more. The colors are natural, but the black levels are rather greyish, with the screen backlight visibly seeping through when showing a black background, for instance.
Screen brightness is enough for decent outdoor operation of the phone on a cloudy day, though you'd have trouble telling what's on if it's sunny outside and shining on the display. Viewing angles could be better, and yet, since it's an IPS panel, contrast and brightness do not start shifting until after the 45 degree mark, and deteriorate only at extreme angles.


Interface and functionality
There's not much to say about the interface on the Sierra S1, for the simple fact that it is running almost stock Android 4.2 Jelly Bean, with a couple of extra widgets peppered on for a good measure, and a “G” letter branded in the lock screen circle.
Gigabyte doesn't even provide any apps outside of the stock ones, save for a file browser and a flashlight. It has licensed the excellent TouchPal keyboard as default, though, providing Swype-like finger tracing functionality in many languages.
Processor and memory
A quad-core MediaTek MT6589T is nothing to write home about, despite the number of cores, as these are frugal Cortex-A7 processors, clocked at 1.5 GHz , which are not exactly powerful. The basic PowerVR SGX544 GPU isn't the most peppy either, so you'll notice some lag and hiccups both in the interface and browser, and while going in and out of apps. The phone sports 1 GB of RAM for some basic multitasking, and only 4 GB of internal memory, but it does provide a memory card slot, so you can expand with up to 32 GB more.
Internet and connectivity
The stock Android browser as well as the installed Chrome browser's performance is pretty basic on the phone. Zooming is choppy, and panning around introduces quite a bit of lag. Text reflow works as intended, though, snapping the article text into the screen width for easier reading, and scrolling is generally fluid.
The Sierra S1 supports 42.2 Mbits HSPA+ download speeds, and features Wi-Fi, Bluetooth 3.0 and A-GPS connectivity, FM radio and that's about it. USB on-the-go is supported, meaning you can plug a flash drive in the microUSB port with the respective cable, and the phone will recognize its content.
Camera
The phone features a 13 MP camera with LED flash on the back, and the camera interface offers a few basic shooting modes like HDR and Panorama, as well as a couple of color effects you can apply. Gigabyte sets the Sierra S1 apart by providing a dedicated camera button, so you don't have to rely only on the virtual shutter key.
Photos appear detailed enough for the resolution, though fine detail like tree branches and shrubbery show as a colorful mess on several photos. Noise is also a problem, easily visible even in rather good lighting conditions, which is not the case with other 13 MP handsets out there. Despite the apparent lack of noise-suppression, overall the images appear too soft, especially towards the edges. The color representation is natural, but there often is a pinkish hue cast over the frame. Scene exposure is a mixed bag, too, with the Sierra S1 often under- or overexposing the images, making them appear too dark or overly bright than what's in reality in front of the camera lens.
Indoors the phone showed passable performance, although the photos are definitely on the noisy side. The Sierra S1 may set the ISO as high as 2000+, which results in very grainy images usable only in small size. The LED flash is rather weak, failing to properly illuminate the scene from about a five feet distance.
Video is captured with 720p resolution and fluid 30fps, flaunting a decent video sound recording quality. It's fairly soft, too, though the detail situation is decent.
Multimedia
The stock Android gallery offers a grid thumbnail view of your photos and you get a few editing and color effect options built into the app. Google Play Music is used for your tunes, which allows you to set a couple of equalizer presets to suit the genre. The loudspeaker is of average quality, with decent strength, but somewhat flat sound. Video playback runs MKV, DivX and Xvid file formats without a hitch up to 1080p of resolution, though besides a loop function you can't find much other options in the default video player.
Call quality
Voices sound tinny and somewhat crackling in the earpiece of the Sierra S1, which might ruin the conversation, especially when there are distracting noises around. The sound coming out is with enough strength for hearing the caller around said noises, it's just that the voices get digitized and intonation intelligible. The microphone situation is slightly better, with enough strength and clarity, although the other end commented we sound muffled and somewhat unnatural.
Battery
The 2000 mAh battery is rated for the abysmal 4.5 hours of talk time, and the decent 25 days on standby. This talk time rating is rather low by any standard for a 2000 mAh battery, though it might have something to do with the dual SIM mode that has to maintain connection with two networks while you are talking, for instance.
Conclusion
At a price hovering between $250-$300 at various retailers without contract subsidies, the Gigabyte GSmart Sierra S1 is setting itself against formidable competition, like the Motorola Moto G, for example, which is much cheaper, yet offers superior performance.
The 13 MP camera on the Sierra S1 is the big disappointment, and the MediaTek processor coupled with 1 GB of RAM make for a subpar experience. If you aren't much of a shutterbug, though, and need a dual SIM device, the Sierra S1 will offer you a solid, pleasant design, and good media playback abilities on the largish display.
For about the same money, however, you can now get the dual SIM Alcatel One Touch Idol X, which is more compact, and still offers a 5” 1080p display, as well as a much better 13 MP camera. The Galaxy Grand 2 is also a nice dual SIM alternative, but it's likely to cost you more on account of the Samsung branding.
Software version: Sierra_S1_V1.34.13


Things that are NOT allowed:
To help keep our community safe and free from spam, we apply temporary limits to newly created accounts: