Apple records biggest quarter in the history of the world: here is how it looks in charts

To put things better in perspective, we look at the performance of Apple as a company throughout the years, the continually growing importance of the iPhone and we ponder whether Apple is now the one-trick pony many claim it has become. All of this, we can understand with charts and we've got a lot of them right below.
Highest revenue scored by any company in a single quarter
Before we dive in, let's make one thing clear: the past quarter, Q1 2017 in Apple's fiscal year, or the last calendar quarter for 2016, was not only Apple's strongest Holiday quarter ever, it was also the best quarter of any company ever. Apple scored a $78.29 billion in revenue, topping its previous $74.78 billion best in fiscal Q1 2016 and the third-best $74.47 billion in Q1 2015.At the same time, this was not Apple's most profitable quarter: while revenue was at a record high, the actual net profit of $17.89 billion was below the record $18.36 billion in the same quarter last year, and even behind the $18 billion in Q1 2015. Let's see what caused this.
iPhone
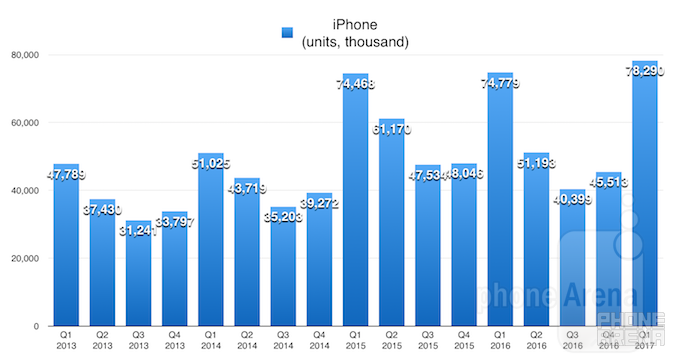
It was not the iPhone. The Apple iPhone sold more than analysts expected at a whopping 78.3 million units in just one quarter. What's most notable is that the most popular iPhone this quarter was the new iPhone 7, proving wrong so many analysts who speculated that users bought more of the older iPhone 6s. Apple chief executive Tim Cook admitted that the company could only reach demand-to-supply balance in January 2017, so there is definitely no slow down in demand for the new iPhone. The iPhone 7 Plus was also obviously supply-constrained.
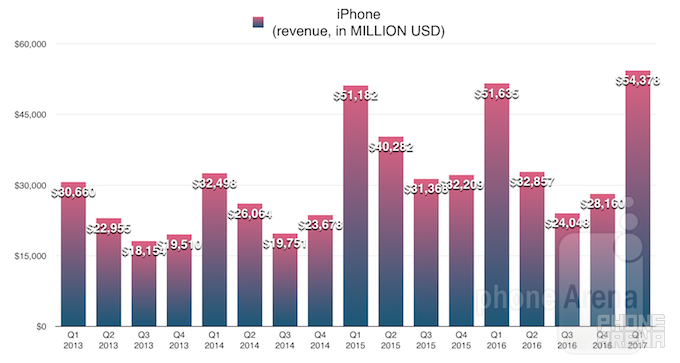
Unsurprisingly, this drove the highest ever revenue from iPhone. Apple scored $54.38 billion in iPhone revenue in this quarter, beating even the bullish expectations from analysts.
iPad
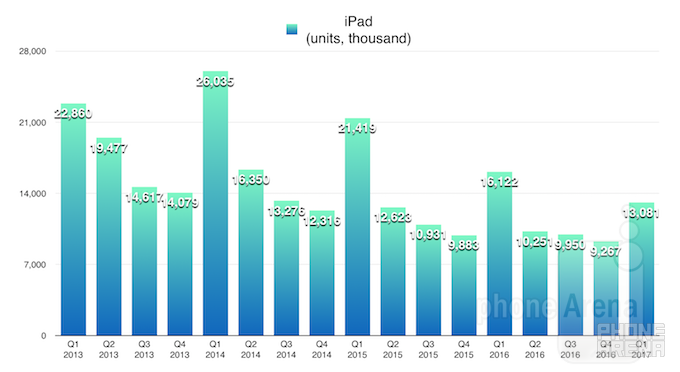
But then there was the iPad. The iPad is still a hugely successful business by any common measure. At 13 million units sold, it obviously outsells traditional computers from any individual company, but it's also painfully clear that the iPad is in decline and that decline has been steady and going on for years. In fact, the iPad peaked way back in Q1 2013 and Q1 2014. It's interesting to look at that peak because it coincides with the launch of the iPad Air, which was by many accounts the largest significant upgrade to the iPad line-up. One could argue that customers don't see much point in upgrading over the iPad Air currently, and that Apple will need to provide something truly innovative to get people excited about the iPad again. Rumors are that a new 10.5-inch iPad is coming this Spring, though, so the wait should not be long.
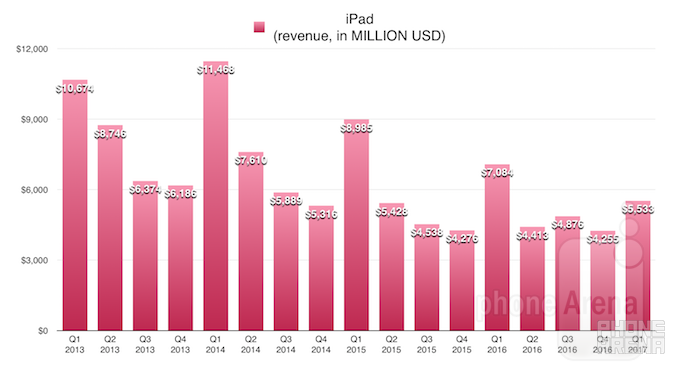
Along with a decline in sales units, comes a dip in revenues from iPad. Still, Apple made $5.5 billion on the iPad in a single quarter, clearly ranking the iPad alone the size of a Fortune 100 company and a success by any financial measure. Yet still, it is clear that in comparative terms the slow-down in iPad sales was one contributing factor why Apple's net profit for this quarter could not exceed profits in the past two years.
Revenue and Net Profit
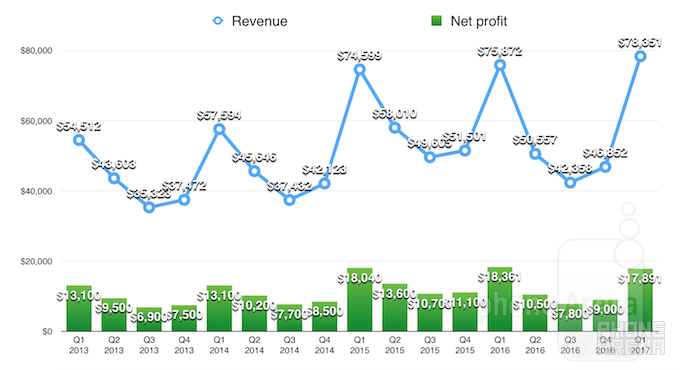
And here are the total Apple revenue and net profit plotted over time. You can clearly see the funny up-tick pattern with every Holiday quarter when Apple sales are surging up. One number that you don't see here, but that is implicit is the gross margin. It amounts to 38.5% for this quarter, down from 40.1% in the same quarter last year. This has a lot to do with the mix of products that Apple is selling, but we will understand it better when we look at the average selling prices further on.
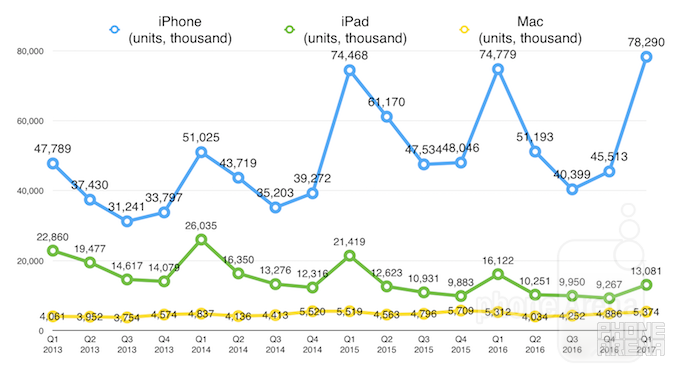
Next up, you can see how many units of its three major categories has Apple sold throughout this quarter. Regretfully, Apple does not post sales numbers for its Apple Watch, but we do know that the Watch has just had its best quarter, and analysts project that sales of the wearable grew over 5 million units.
Services
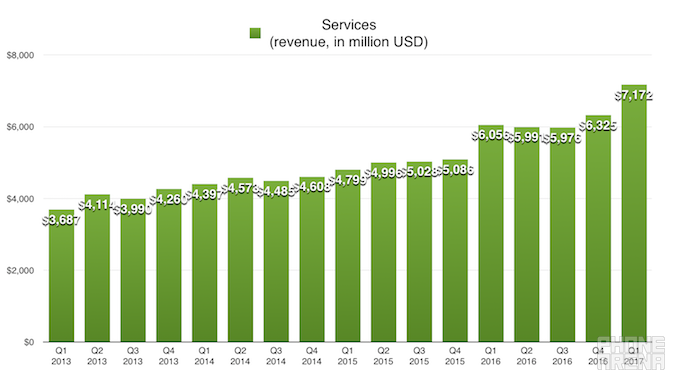
In the beginning of the article, we said that many point out that in recent years Apple has become a one-trick pony, the iPhone company. That's a fair observation, but it's also true that Apple under Tim Cook is growing one other category strongly and that growth was particularly evident this quarter. It is the Services category including revenues from the App Store, Apple Pay and iCloud. In Q1 2017 it reached a record $7.2 billion of revenue, and it's now a bigger business than the iPad and will likely soon overtake the Mac. Apple aims to double revenue from services in just four years, according to Tim Cook.
Average Selling Price
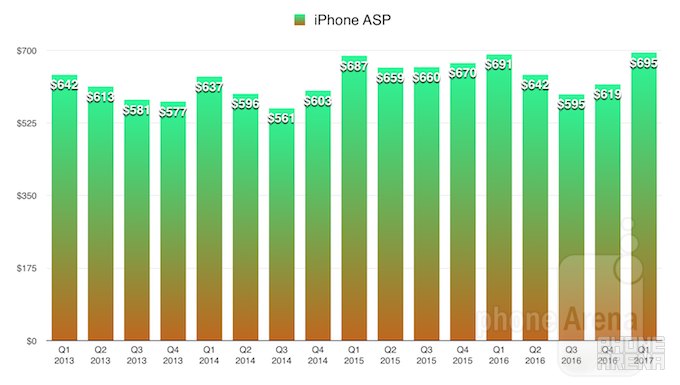
One thing that analysts got hilariously wrong was the average selling price (ASP) of the iPhone this quarter. While Bloomberg projected iPhone ASP falling down, it actually grew to a record $695, obviously thanks to strong interest in the pricier iPhone 7 Plus and higher storage tiers of the regular iPhone.
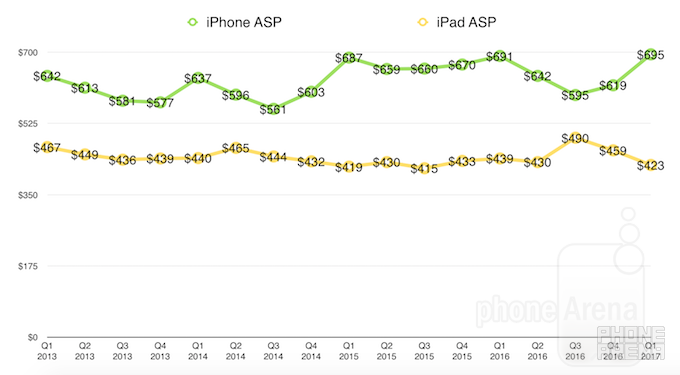
You can also see that the iPhone has been on a slow, but steady upwards curve when it comes to average selling price, while the opposite has happened with the iPad. This is an interesting trend that once again proves the popularity of older models like the iPad Air 2 and a lower share of the iPad Pro in Apple's tablet mix. That's not a surprise given the somewhat niche creative target audience of the Pro iPad, but it's still one thing to note.
Apple, an iPhone company
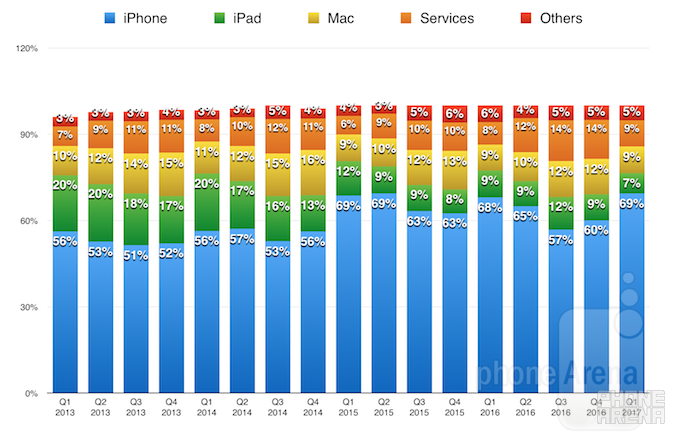
Finally, you can see the current reality of Apple that is still predominantly an iPhone company. The iPhone share in revenues stays relatively consistent with some other categories rising, while others decline.
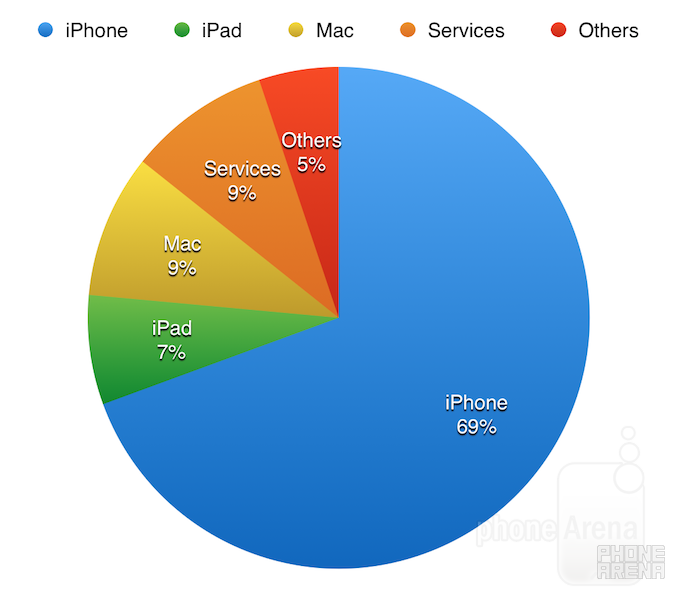
The iPhone was 69% of Apple's whole business this quarter, and you can see that Services and Mac were tied for the second place, while iPad fell back to fourth and others make up 5% of Apple's total revenue.
Conclusion
In conclusion, it's important to understand just how big of a company Apple is. It just posted the biggest revenue of any company in the history of the world (not counting the acquisition-merger driven results of Vodafone and Fannie Mae). It recorded its third-best quarter in terms of profit. Its shares are near their record high, yet still they are trading at less than a 16 price-to-earnings ratio, while Amazon's growth-driven stock trades at a P/E of 190 at the time of this writing, Netflix trades at a P/E of 330, and even Google trades at a P/E of 30. Looking at things this way, you understand why Apple continues buying back its own stock.
What drives all these profits, however, are not numbers: it's actual products and customer satisfaction, two areas, where Apple excels. And with the 10th anniversary iPhone coming up late this year, we can see the company gearing up to beat its records once again.

Popular stories


Latest News


Things that are NOT allowed:
To help keep our community safe and free from spam, we apply temporary limits to newly created accounts: