Xiaomi Mi Max 2 Review

Introduction
Xiaomi Mi Max 2 review unit provided by our friends at EuDirect.Shop
For the second year in a row, Chinese phone maker Xiaomi has produced a device that takes the word “phablet” to another level. Much like its predecessor, the recently-released Mi Max 2 employs a massive 6.44-inch screen, but also packs improvements in several key areas.
While undoubtedly welcome, these enhancements also come hand in hand with a bigger price tag, so let's put this exotic smartphone under scrutiny and see if it's worthy of your attention.
Design
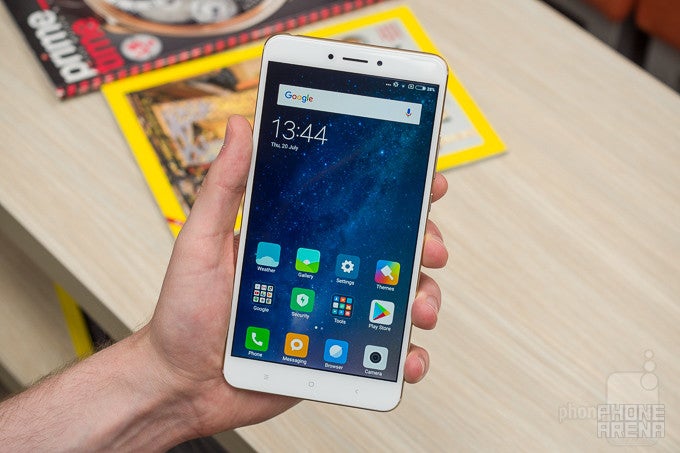
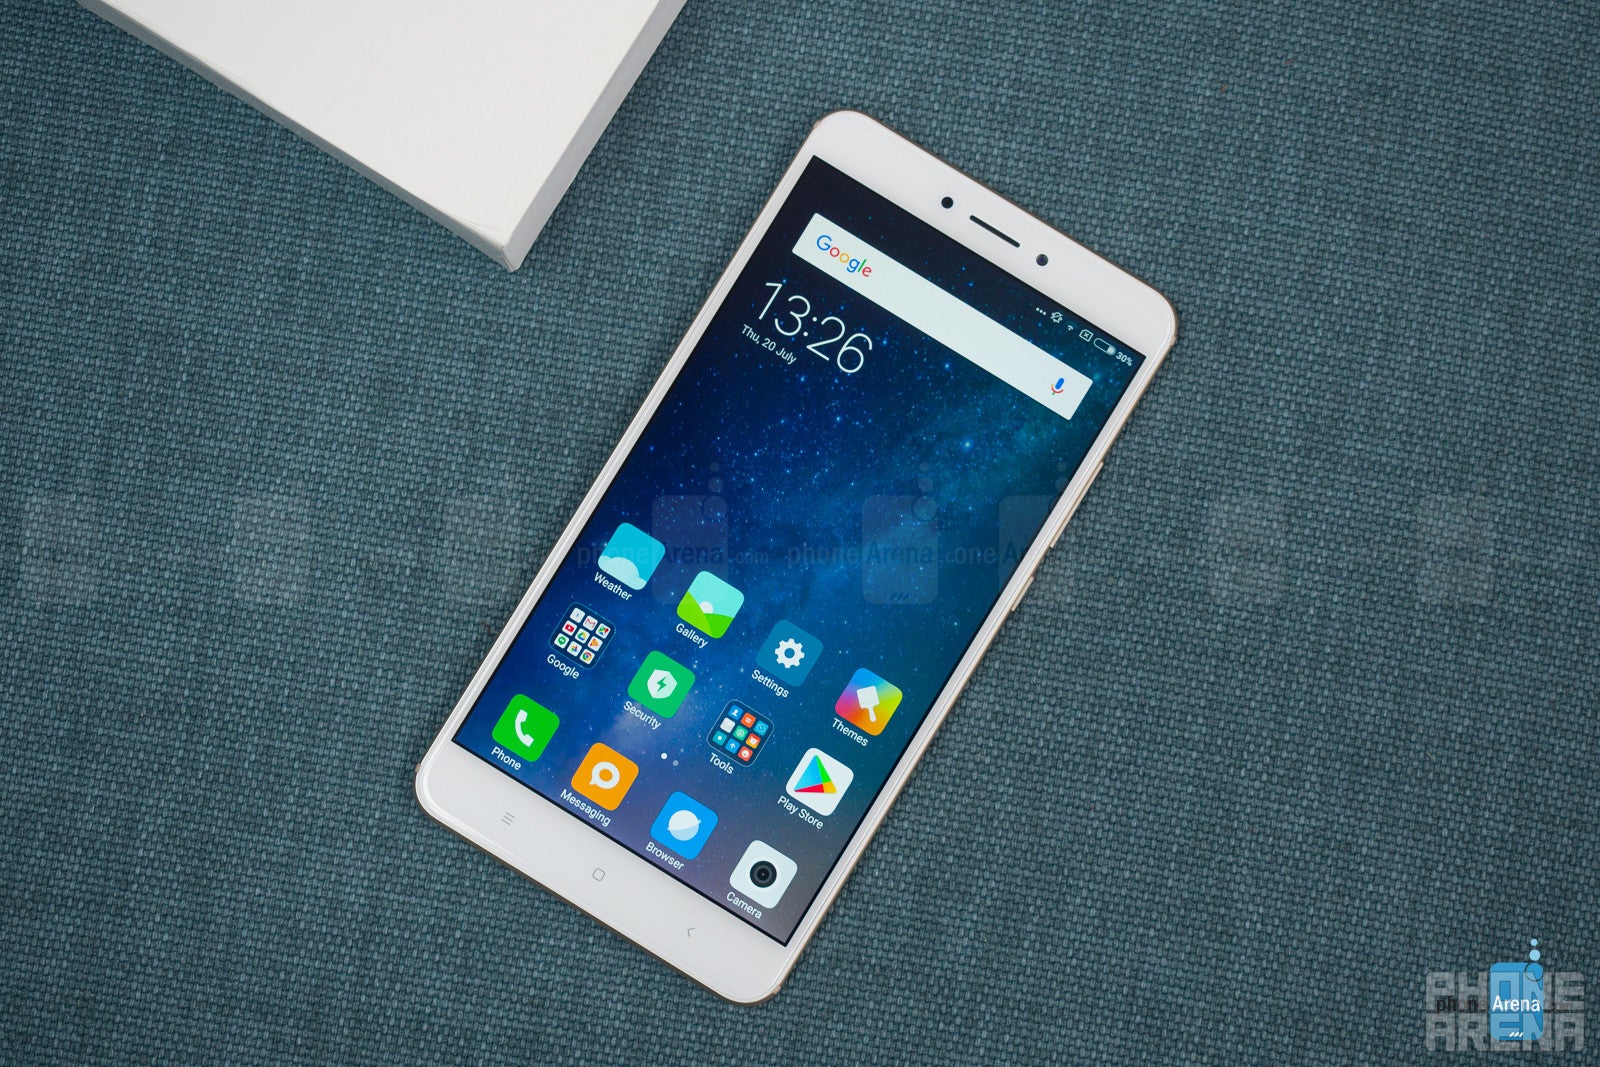
As we live in the year of “all-screen” phones, we can't really say that the bezels on the Mi Max 2 are all that slim. Still, the phone works out a good screen-to-body ratio of 74.13%.
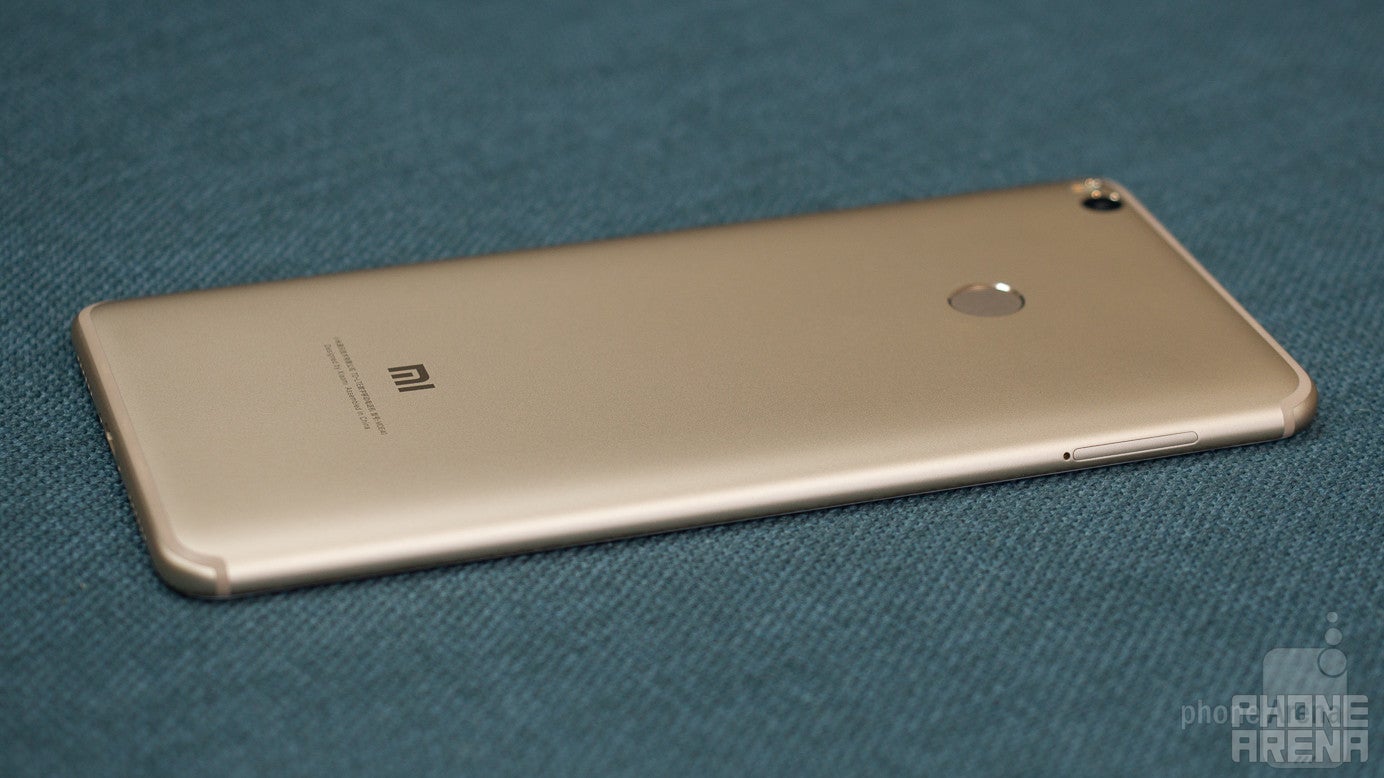
Compared to the first iteration, there's a big improvement in terms of build quality. This year's model is larger and heavier, but it does feel more premium and comfortable to hold thanks to its all-metal unibody and rounded edges. The power and volume keys feel sturdy and responsive.
The fingerprint scanner is fast and reliable, and we're happy to say that Xiaomi has included a type-C USB port this time around.
Overall, we like the design of the Mi Max 2, but it's important to remember that a device of this stature is not suitable for everyone.

6.85 x 3.49 x 0.3 inches
174.1 x 88.7 x 7.6
7.44 oz (211 g)

6.5 x 3.11 x 0.32 inches
165 x 79 x 8.1 mm
6.63 oz (188 g)

7.08 x 3.49 x 0.42 inches
179.83 x 88.57 x 10.7 mm
9.14 oz (259 g)

6.18 x 3.11 x 0.31 inches
156.9 x 78.9 x 7.9 mm
6.70 oz (190 g)

6.85 x 3.49 x 0.3 inches
174.1 x 88.7 x 7.6
7.44 oz (211 g)

6.5 x 3.11 x 0.32 inches
165 x 79 x 8.1 mm
6.63 oz (188 g)

7.08 x 3.49 x 0.42 inches
179.83 x 88.57 x 10.7 mm
9.14 oz (259 g)

6.18 x 3.11 x 0.31 inches
156.9 x 78.9 x 7.9 mm
6.70 oz (190 g)
Compare these and other phones using our Size Comparison tool.
Display
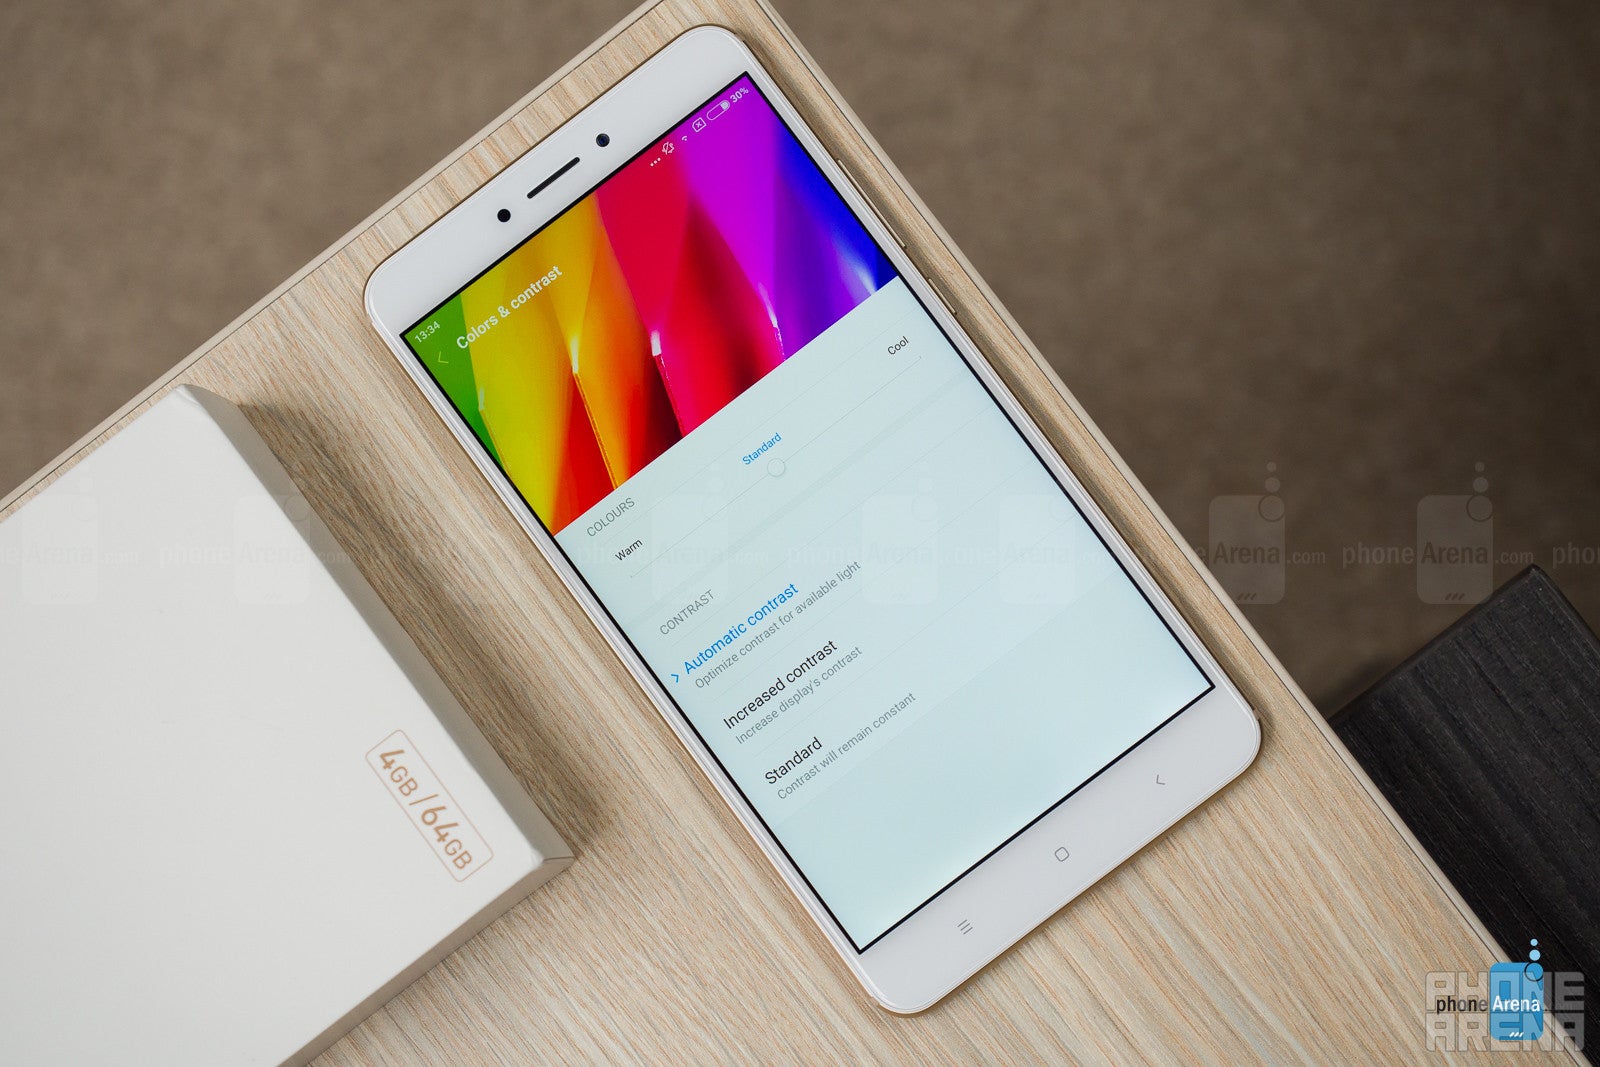
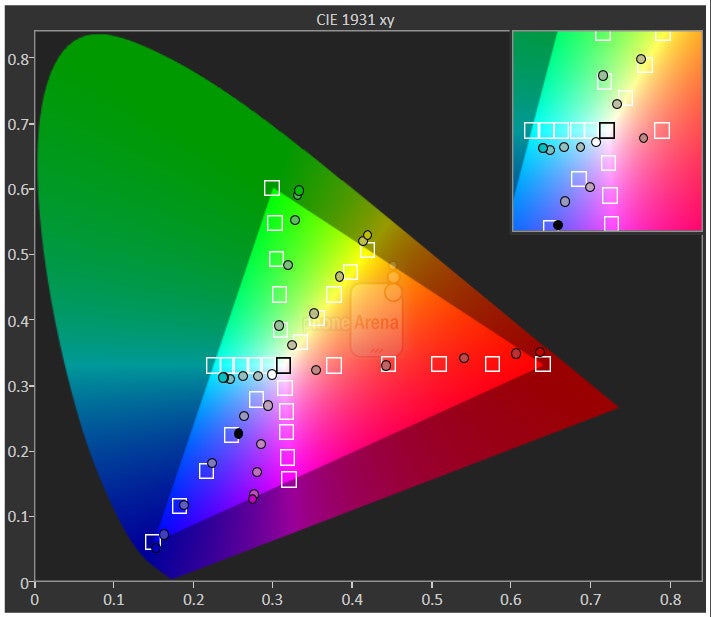
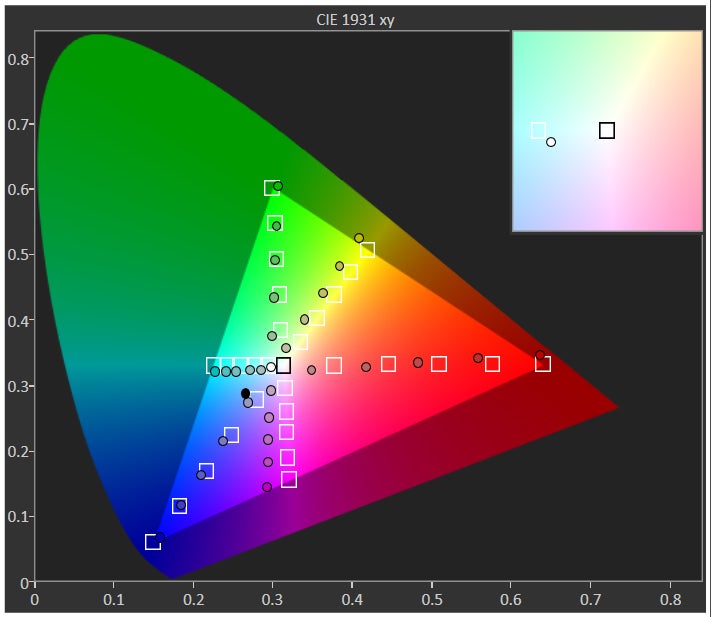
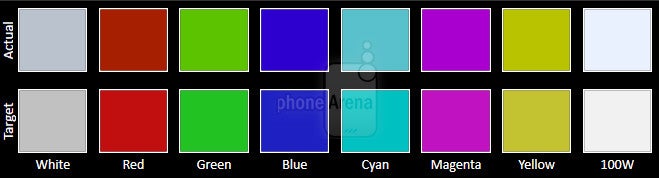
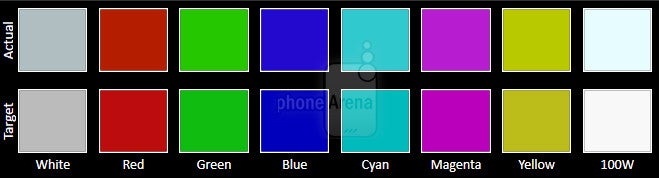
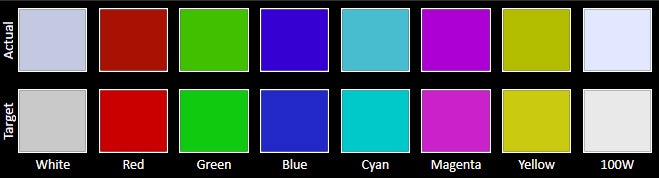
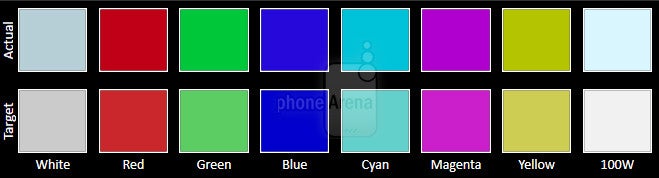
The obvious highlight of the Mi Max 2 is its humongous 6.44-inch LCD display. Its 1,080 x 1,920 resolution works out a pixel density of 342ppi, which is not ideal, but sufficient. Viewing angles are good and the screen seems to be a bit less reflective than the original Mi Max, but the maximum brightness level has been reduced for some reason. As such, outdoor visibility isn't a strong point of this display.
With a color temperature of 7500K, most colors and shades appear bluer than intended, but we do have to note that the situation is better than with the original Mi Max which had an even colder screen. All in all, we're happy with the display's performance, given the fact that the phone costs about $300.


Interface and Performance
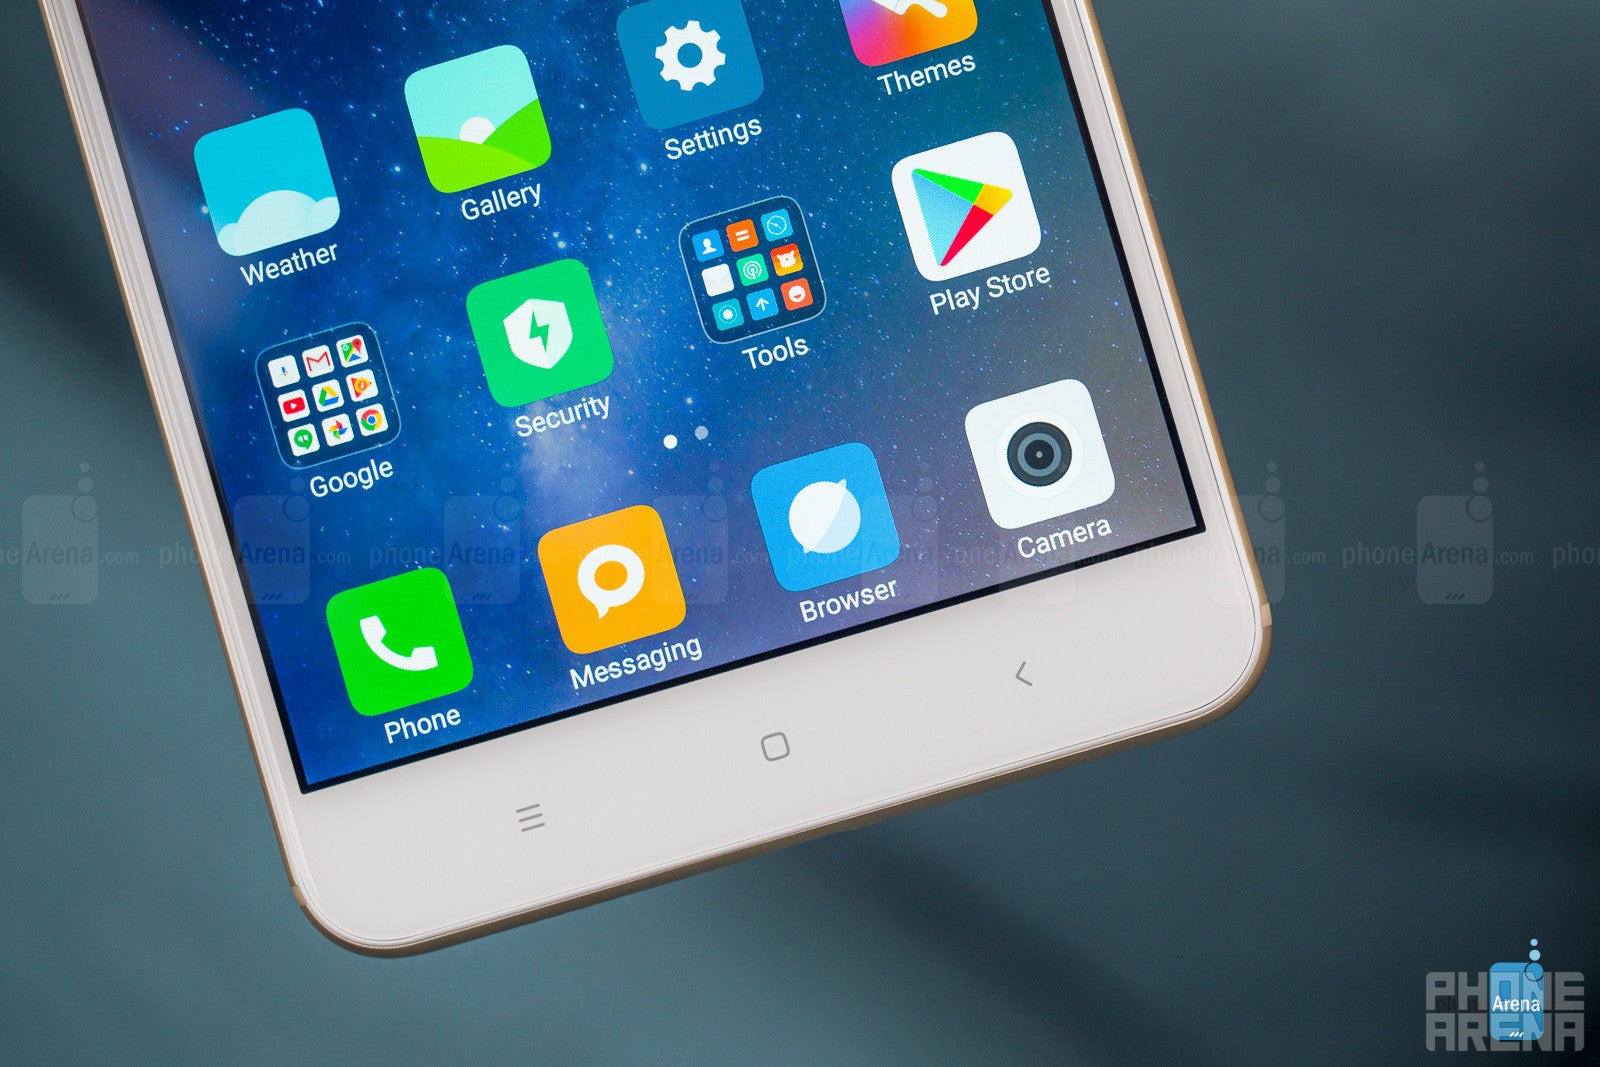
With Mi Max 2, you'll get Xiaomi's custom MIUI 8.5 skin which is based on Android 7.1.1. Sure, it does look a lot like iOS, but we certainly appreciate some of the nifty features that are on board.
In terms of performance, some of you might be disappointed, as Xiaomi has opted to replace the Snapdragon 652 that was present on the first Mi Max with the Snapdragon 625. The 625 is less powerful, but it's built on a newer 14nm process. This means that demanding games and apps won't run as smoothly on the Mi Max 2, but the handset is more power-efficient.
Still, the Mi Max 2 will be able to handle most of your daily needs without too much trouble, and navigation through the UI is generally stutter-free, save for the search function in the Settings menu. Depending on the quantity of the search results, a delay of 2-4 seconds can be experienced before they are displayed, which kind of ruined our otherwise good impressions.
In terms of internal storage, the handset comes in two versions – a 64GB one and one with 128GB of the stuff. Both have a microSD expansion slot and feature 4GB of RAM.
Camera
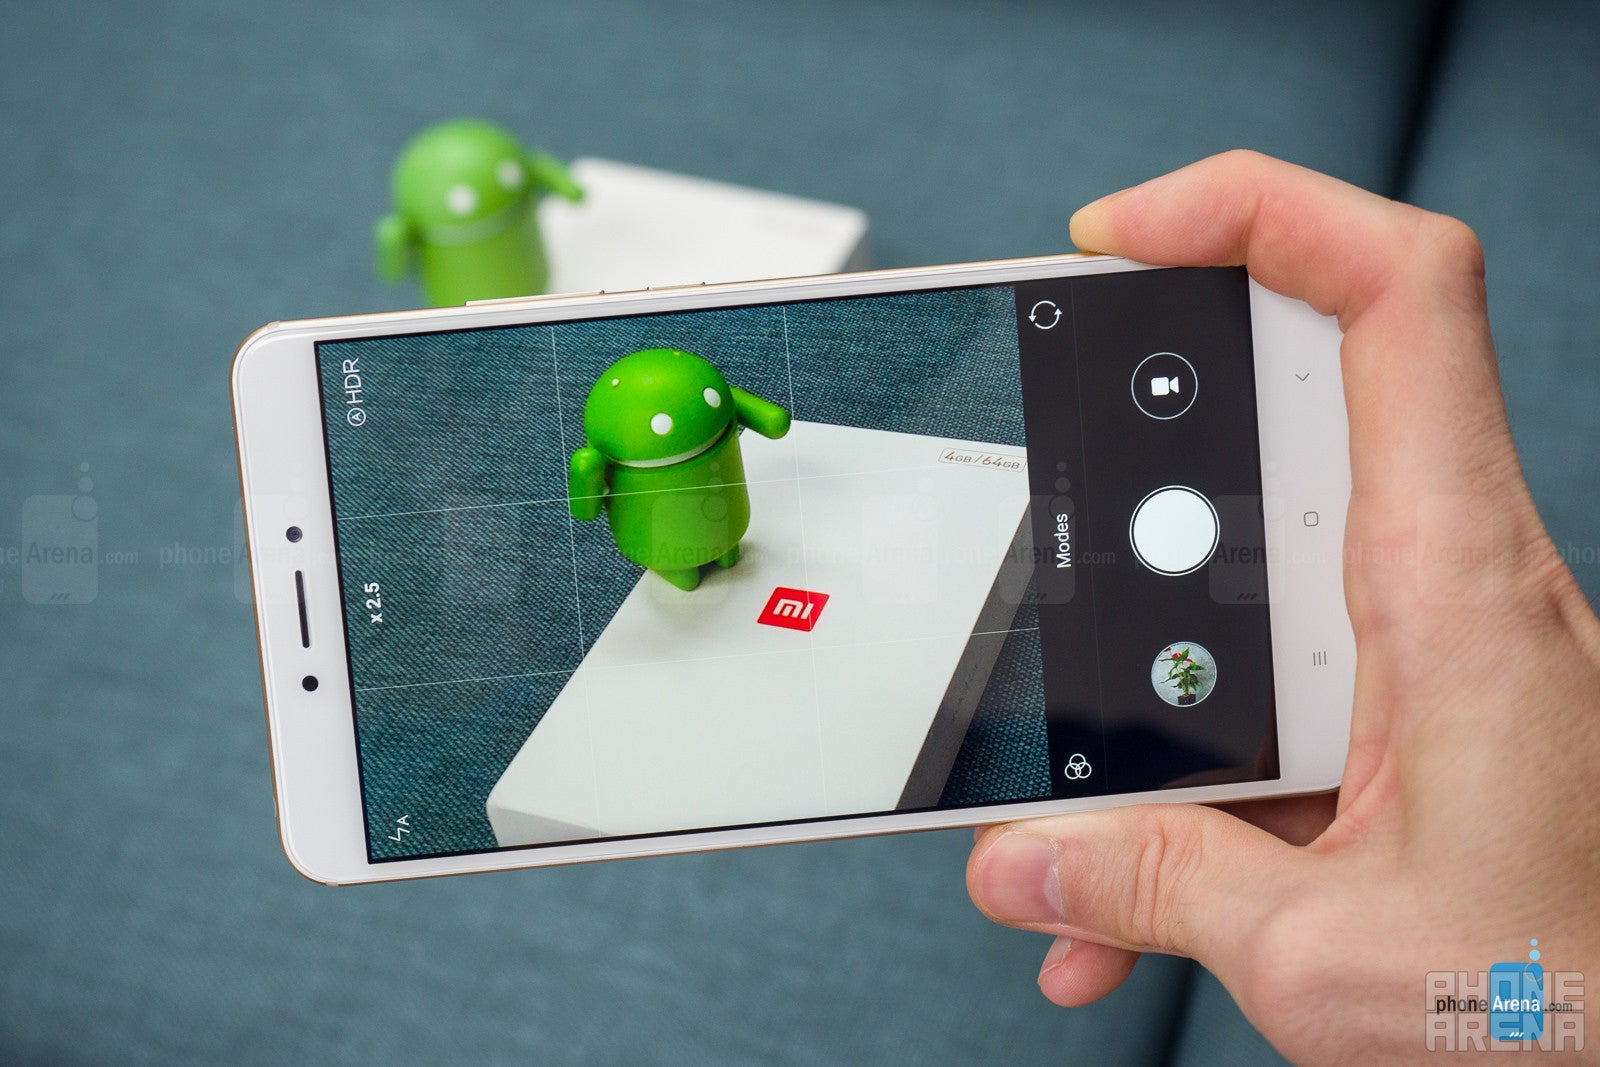
Camera app interface
The Mi Max 2 features a single 12 MP f/2.2 main sensor with Dual-LED flash, and a 5 MP selfie cam. On paper, this might look as another downgrade compared to last year's model which packed a 16 MP f/2.0 camera, but in practice this is not the case. Xiaomi has enlarged the pixel size on the main shooter (from 1.0μm to 1.25μm), and this increase has resulted in an overall improvement of image quality.
We were able to take some pretty decent shots, even in less than perfect day conditions. Exposure levels are generally good, and the color representation seems to be fairly accurate. Low-light performance is nowhere as impressive as photos tend to come out noisy, but Xiaomi's HHT (Handheld Twilight) mode does help out with increasing sharpness.
The camera app is quick to open and shoot, and it has a good selection of modes and filters. As for the front sensor, it can produce some good selfies, but we would advise turning beauty mode off.
Xiaomi Mi Max 2 sample images
Video recording
We certainly didn't feel amazed while recording video with the Mi Max 2. Sure, being able to capture 4K video on a mid-ranger is great, but the autofocus feature is very unreliable and the lack of optical image stabilization can result in some pretty shaky clips.
Xiaomi Mi Max 2 sample videos
Multimedia
The Mi Max 2 has what's needed to satisfy your multimedia needs. Whether you like to play games, watch videos, or even full-length movies on the go, the phone's colossal screen has you covered.
We also have to give props to Xiaomi for including stereo speakers this time around. The composition is quite interesting – the speaker on the bottom takes care of the bass and lows, while the one embedded in the earpiece prioritizes mid and high frequencies. The sound coming out of there is crisp and sufficiently loud, so we can safely label the current Max model as “above excellent” in this department.
Call quality and connectivity
We have no qualms with the way the Mi Max 2 sounds during calls. The earpiece is loud enough, and the sound quality is decent. We're easily understood on the other side of the line.
It's important to note that the handset is incompatible with the majority of 4G bands in the USA. However, 3G support should be available with AT&T and T-Mobile. If you're living in Europe, make sure that your carrier uses either LTE band 3 or 7, as 20 is not supported.
As for connectivity options, the only thing missing from this smartphone is NFC, so Android Pay isn't available. Otherwise, the hybrid SIM tray allows you use either two SIM cards or a SIM and microSD card. All the other goodies are on board, such as Bluetooth 4.2, GPS, the latest Wi-Fi standards, and so on.
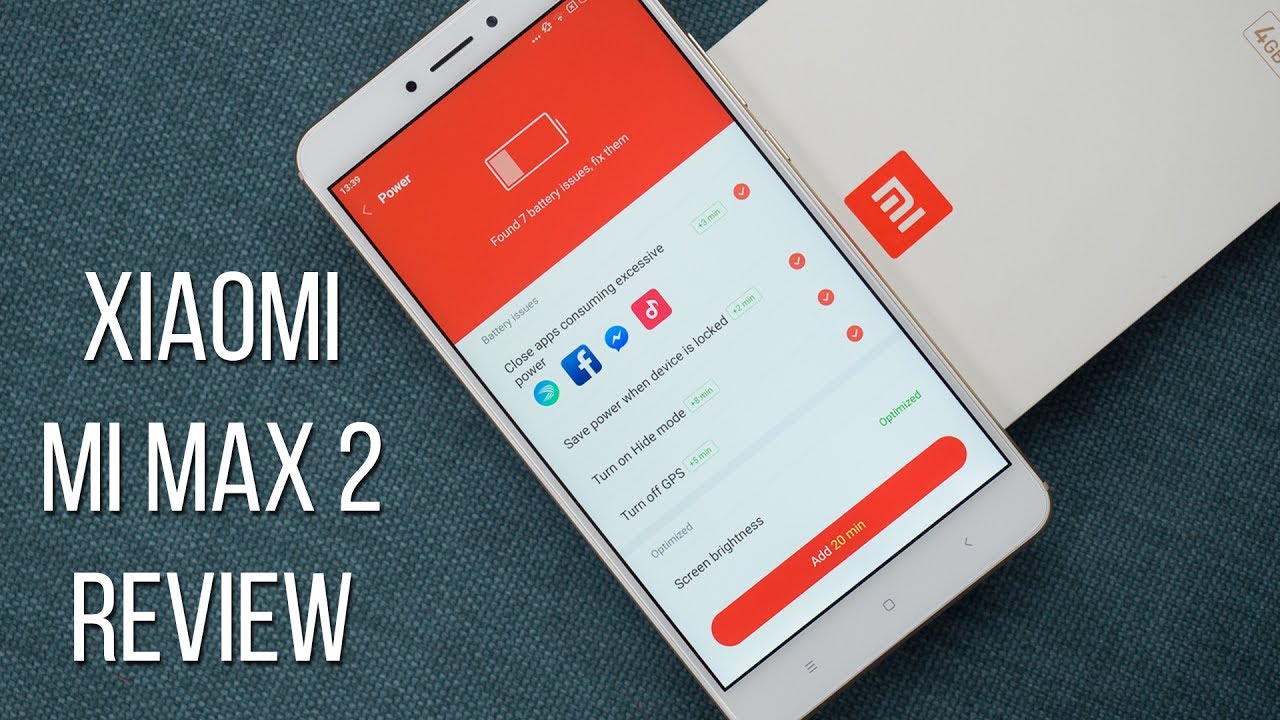
Battery
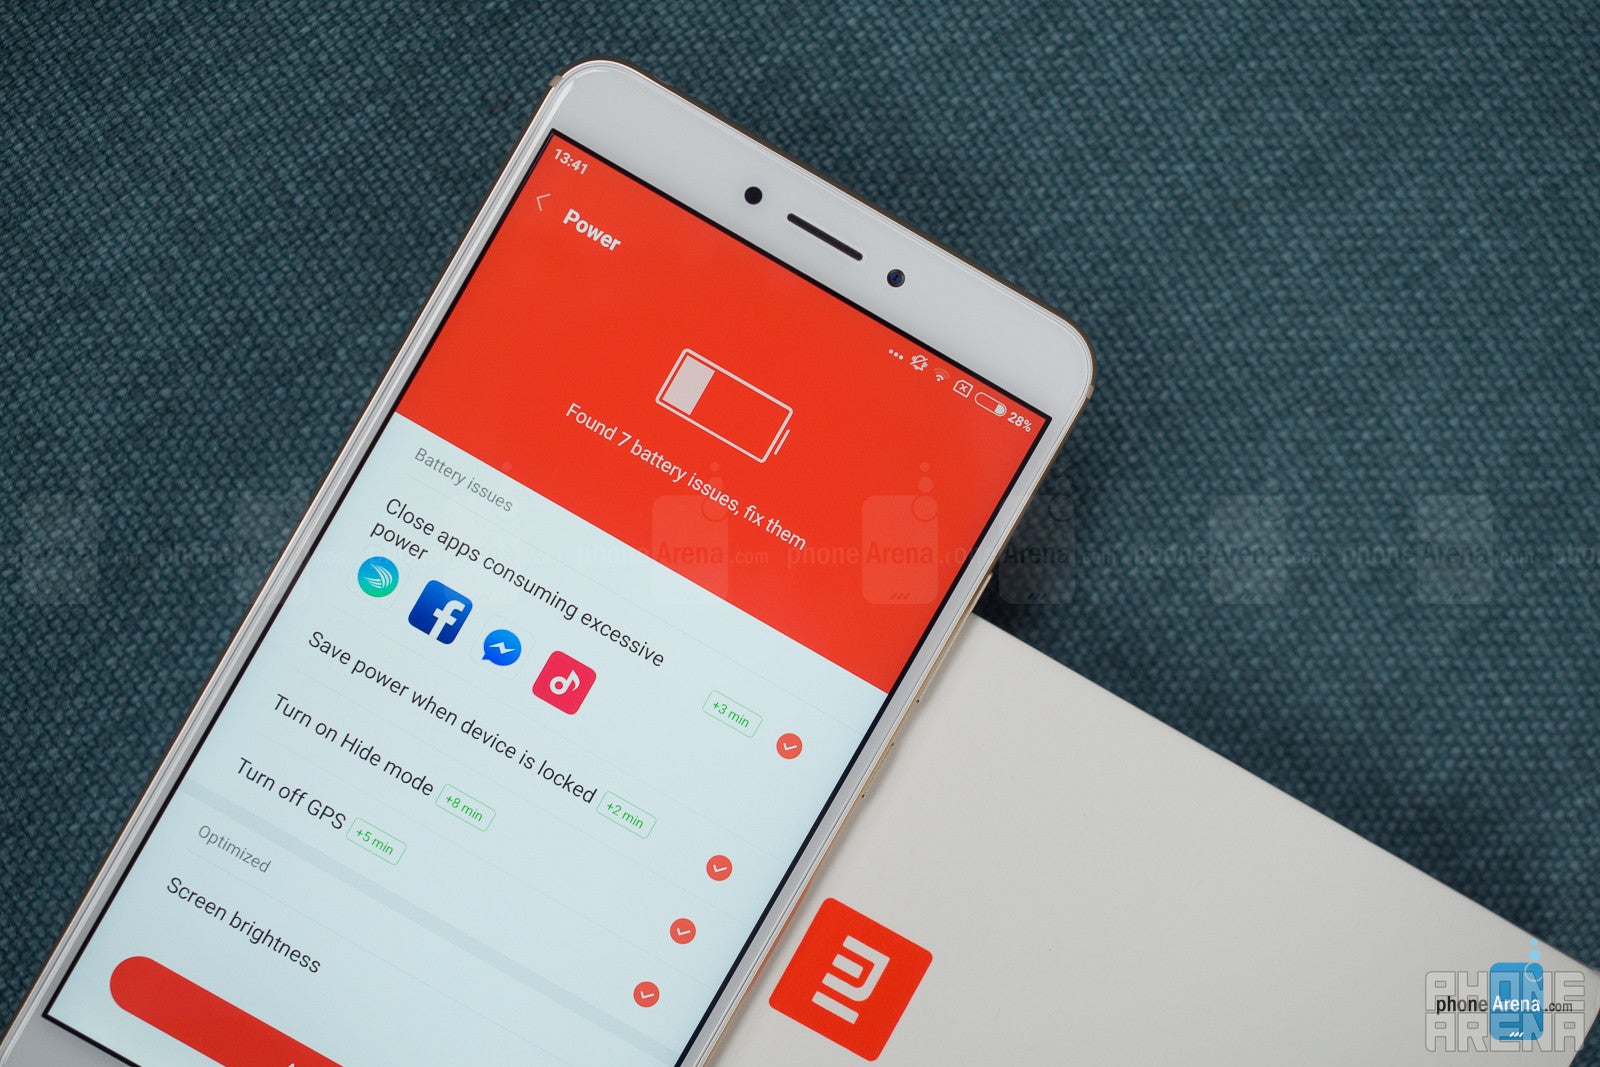
The battery life on the Mi Max 2 is unbelievable. It's hulking stature hosts a power cell with a capacity of 5,300mAh. Combine that with the energy efficient chipset, and what you get is record-breaking durability.
The Mi Max 2 clocked in at 17 hours and 22 minutes in our custom battery tests. It managed to beat LG X Power, the former champ in this category, by over two hours. To put things into perspective, it's more than twice as durable as the iPhone 7 (7 hours and 46 minutes) and the Samsung Galaxy S8 (8 hours and 22 minutes). Two days between charges is pretty much guaranteed on this device, and with moderate use this number can easily go up to three or four days.
Meanwhile, the charger supports Qualcomm's Quick Charge 3.0 technology, which enables the huge battery to go from 0 to 100% in about 2 hours and 15 minutes.
Conclusion
In a fiercly competitive mid-range segment, the Mi Max 2 is a smartphone that simply stands out. It certainly isn't for everyone, but it rewards those who can handle its size with a quality build, adequate performance, decent cameras, and exceptional battery life and multimedia experience.
Yes, it has its flaws, but we're inclined to look the other way, given the fact that the 64GB version costs about $260-$280 (delivery, import and other fees not included). At this price, there aren't many other phones that can compete with Xiaomi's "Max" package.
So, do we recommend the Mi Max 2 as a good purchase? Well, is it compatible with your carrier? Will you be comfortable with using a device of this magnitude? Can you live with the fact that service and support may be limited in your country? If the answer to those questions is "yes", then so is ours.
Xiaomi Mi Max 2 review unit provided by our friends at EuDirect.Shop
Popular stories


Latest News


Things that are NOT allowed:
To help keep our community safe and free from spam, we apply temporary limits to newly created accounts: