
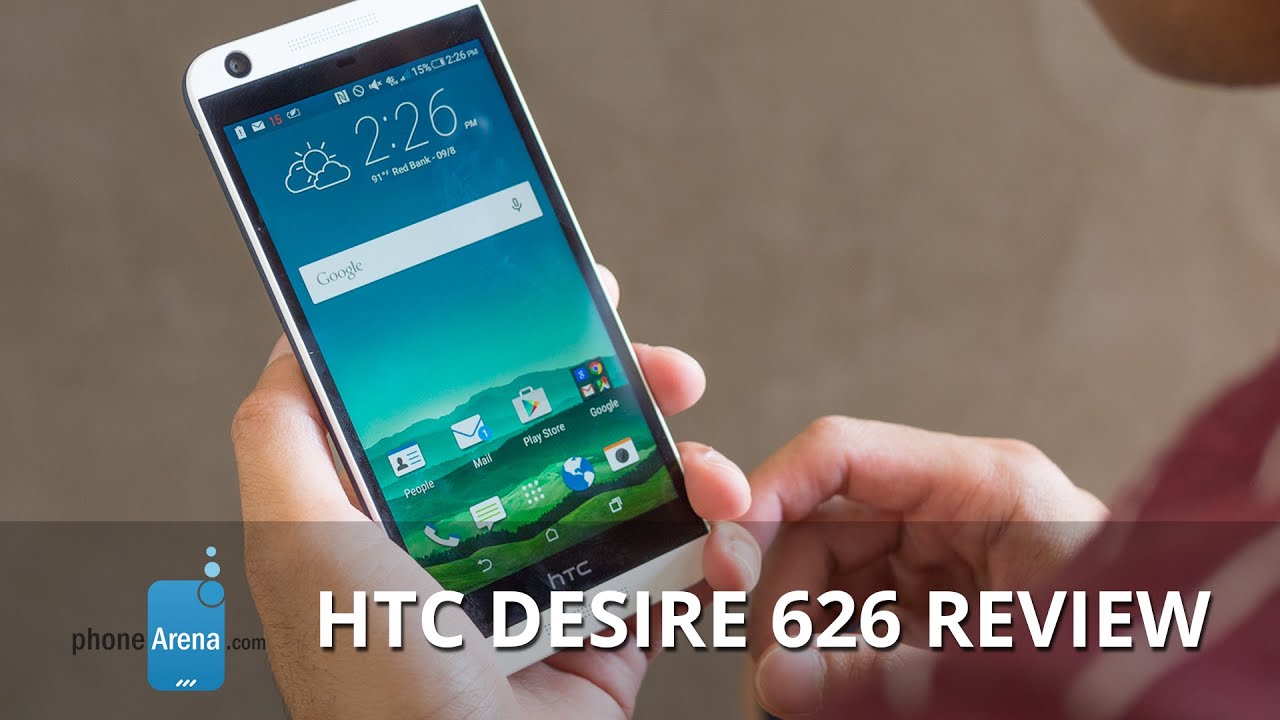
HTC Desire 626 Review
Introduction
One of the biggest surprises in the area of the mobile scene this year is the war that’s been waging in the entry-level segment – you know, phones that are priced below $200. Taking into account that carriers have totally ditched the subsidy model that we’ve all been accustomed to following, it’s going to be even more crucial for phones to really show that they have a ton of value for the money. Even though it’s been a tough year for HTC, the Taiwan-based company is always continuing to diversify its robust portfolio. This time, here comes the HTC Desire 626. Knowing what’s out there already, can this sub-$200 offering stand out in a sea already filled with some killer options?
- HTC Desire 626
- microUSB cable
- Wall charger
- Stereo headphones
- Get start guide
- Important information
Design
It’s the same old, very predictable design. Still, it’s pretty charming.
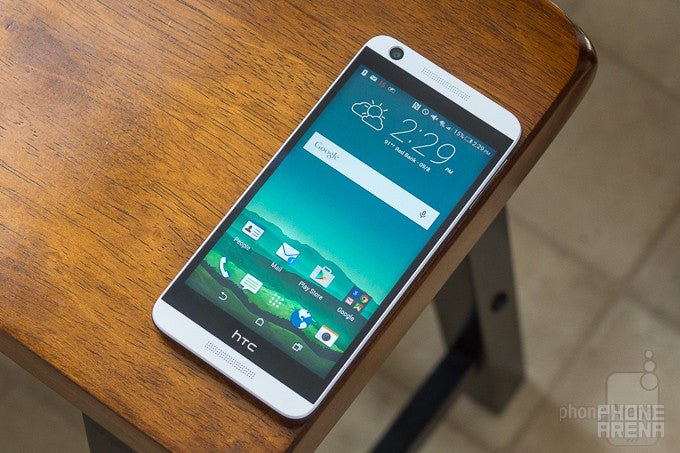
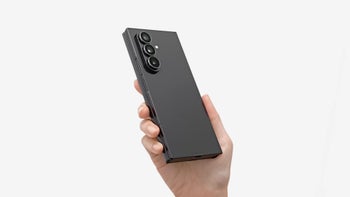
By now, HTC’s Desire line has followed a particular and predictable design language that hasn’t seen any dramatic changes in the last couple of years. So, to no one’s surprise, the HTC Desire 626 follows in familiar fashion with its two-toned, all-plastic construction. Our particular unit, the marine white variant, combines a white body with a blue colored accent, but it comes in other color combinations that we find charming. It’s certainly not an original design, that’s for sure, as it boasts many of the traits we’ve come to expect from the Desire line.

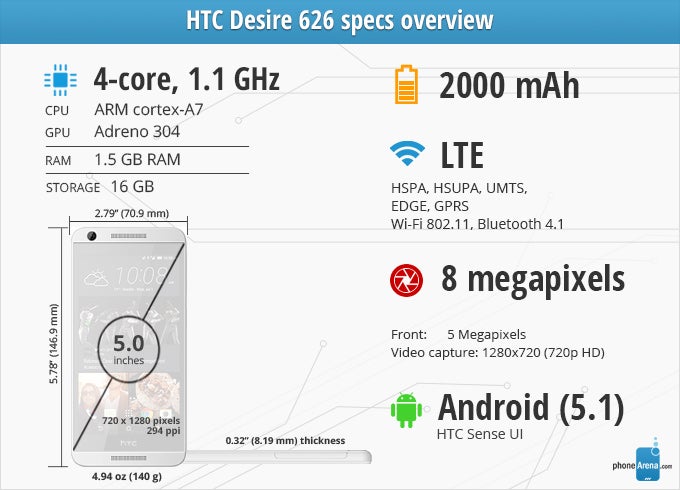
5.78 x 2.79 x 0.32 inches
146.9 x 70.9 x 8.19 mm
4.94 oz (140 g)

5.59 x 2.85 x 0.48 inches
142 x 72.4 x 12.2 mm
5.47 oz (155 g)

5.56 x 2.84 x 0.35 inches
141.3 x 72.2 x 8.8 mm
5.11 oz (145 g)

6 x 3.04 x 0.43 inches
152.5 x 77.2 x 10.9 mm
6.00 oz (170 g)

5.78 x 2.79 x 0.32 inches
146.9 x 70.9 x 8.19 mm
4.94 oz (140 g)

5.59 x 2.85 x 0.48 inches
142 x 72.4 x 12.2 mm
5.47 oz (155 g)

5.56 x 2.84 x 0.35 inches
141.3 x 72.2 x 8.8 mm
5.11 oz (145 g)

6 x 3.04 x 0.43 inches
152.5 x 77.2 x 10.9 mm
6.00 oz (170 g)
Compare these and other phones using our Size Comparison tool.
Display
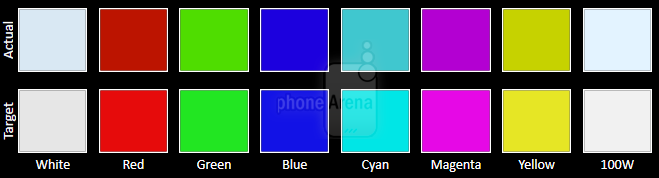
The subdued tone of the display makes it tough for it to stand out.
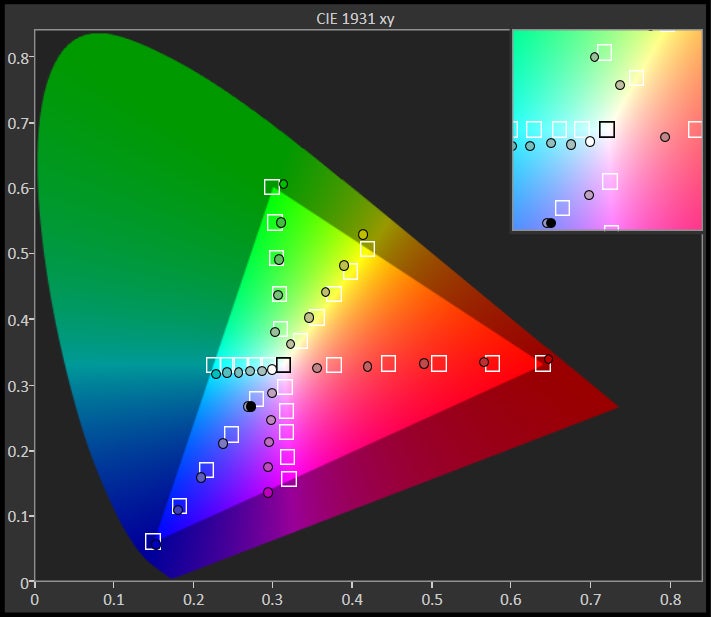
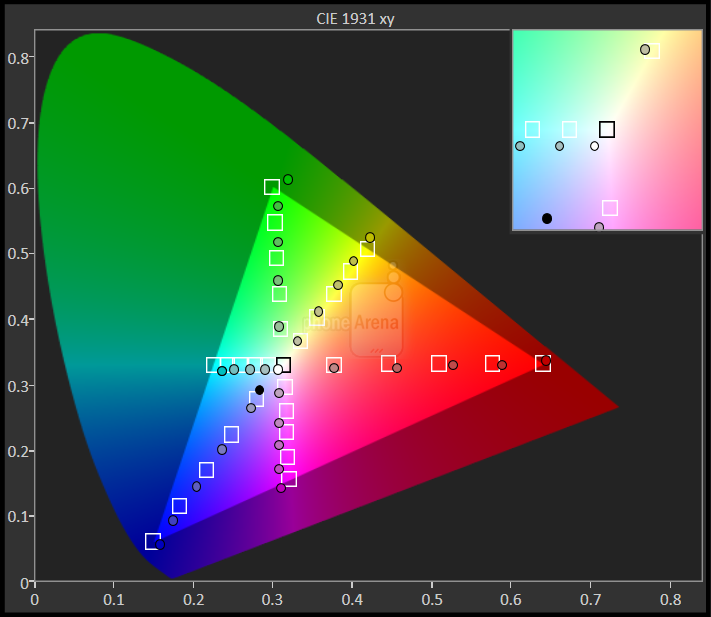
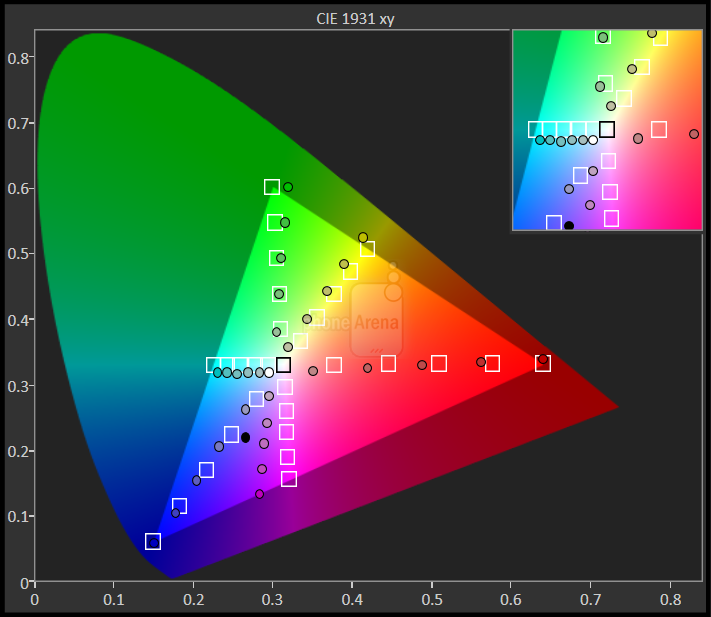
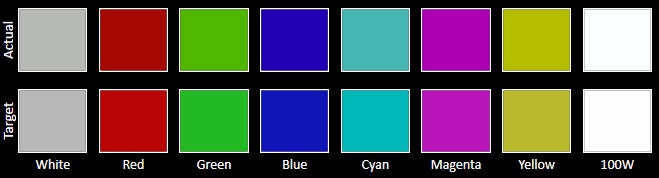
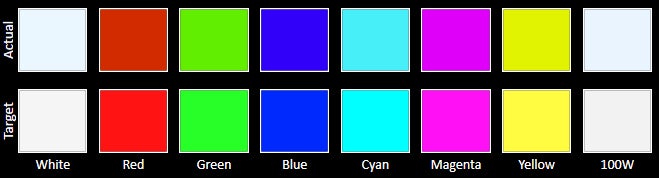
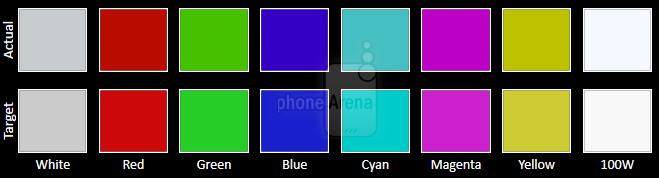
Accompanied with a 5-inch 720 x 1280 Super LCD screen, it certainly fits the bill for a phone in its price category. Neither exceptionally detailed with its 294 ppi pixel density, nor polarizing with its qualities, the display at the very least is effective for everyday use. Surprisingly enough, the panel favors a warmer tone with its ~6300K color temperature, which is close to the ideal reference value if 6500K. Topping it off too, is the fact that it’s able to accurately reproduce most of the color gradients in the sRGB color spectrum chart – save for the colors of green, which have a sprinkling of yellow to them. There are undoubtedly some good qualities about the screen, but there’s just this subdued tone that prevents it from being livelier to the eye.


Interface and Functionality
It’s Sense 7.0 that we all know by now, so there’s nothing really new here.
Now, the only thing really missing here are the various Motion Launch gestures we get in HTC’s higher-end offerings. Regardless of that, the Sense 7.0 experience on top of Android 5.1 Lollipop is highly versatile and customizable to appeal to such a broad range of folks. However, on the other side of the spectrum, it really doesn’t bring anything new to the table that we haven’t experienced on other recent HTC devices.
Processor and Memory
The choice of the going with the Snapdragon 210 chip results in a choppier, less responsive performance.
Out of everything, it’s rather perplexing to know that HTC has opted to put in a quad-core 1.1GHz Qualcomm Snapdragon 210 SoC inside of the Desire 626, as opposed to the Snapdragon 400 chip used by other similarly spec’d phones. The result, though, is a performance that undoubtedly lacks the finesse to really match what the Moto G 2015 puts out. Sure, basic operations are all handled in a good manner, but just expect load times to be longer – plus, it’s definitely not suited for gaming due to its choppiness. The 1.5 GB of RAM the Desire 626 is equipped with tend to be sufficient for most tasks.
Internet and Connectivity
Our exact review unit of the Desire 626, AT&T’s variant, is equipped with the necessary GSM radios to make it a world traveler, but Verizon’s version offers CDMA support in addition to GSM to give it greater compatibility. Besides that, it’s acquainted with the usual set of connectivity features – so expect to find aGPS with Glonass, Bluetooth 4.1, and 802.11 b/g/n Wi-Fi. Sorry people, there’s no NFC here.
Camera
A passable 8 MP shooter that will not inspire you in any way.
Looking into the Desire 626’s camera hardware, it’s presented with an 8-megapixel main rear camera and 5-megapixel front camera combo. The camera interface is the same as that on other Sense 7.0 running phones. However, its shooting modes have been whittled down to only 3 main modes – automatic, HDR, and panoramic. The front camera forgoes having any sort of beautifying options.
Understandably, the camera’s performance is mostly underwhelming. Well, we shouldn’t expect too much considering that we’re dealing with an entry-level offering here, but nonetheless, a slightly more composed shooter would have been much appreciated. Fine details are almost non-existent, as it captures photos that appear somewhat smudgy, which becomes more apparent when there’s less lighting in the shot. Even though digital noise is kept to a minimum in extreme low-light situations, its quality is just too fuzzy and the lack of fine details deprive it from being a strong candidate. However, we do like how its HDR mode performs under high-contrast scenes by focusing on the shadows to giving them increased exposure.
HTC Desire 626 sample images
The problem is not that it maxes out at 720p resolution, but the fact that it produces unbelievably soft and subdued details, which isn’t aided by the heavy noise and crackly voices that its microphone picks up.
HTC Desire 626 Sample Videos
Multimedia
While it’s usable for watching videos, its speaker performance is subdued and lacks depth.
Call Quality
It has its challenges, but the quality is more than acceptable to use when background noise is minimized.
Generally speaking, the Desire 626 is more than handy for phone calls. For starters, the earpiece produces extremely potent voices that make it very easy for us to hear them in even the noisiest of conditions. However, the microphone tends to make voices sound raspy on the other end of the line – while the subdued output of the speakerphone makes it challenging to use.
Battery
For a 2000 mAh battery, it has good longevity.
Don’t be quick to judge this one and its 2000 mAh battery cell, because it achieves better results than some other phones with beefier sized batteries. Judging from our custom battery benchmark test, the HTC Desire 626 obtains a respectable mark of 6 hours and 32 minutes. That’s pretty good in our book, but it’s made better knowing that it’s more than long lasting to get us through at least a solid one-day of normal, real world usage.
Conclusion
Right now, the 2015 edition of the Moto G is the benchmark that many folks will use to compare phones that are within the same scope. Indeed, the HTC Desire 626’s outright price point of $185 makes it an attractive offering, especially if you find its tailored design to be better, but it’s still a somewhat underperforming package that doesn’t threaten the Moto G in terms of functionality. Well, that’s pretty concerning because you’re going to fork over just a smidgen more for it – plus, it lacks the better specs of the Moto G. We won’t deny that HTC has something tangible here for consumers who don’t want to spend a fortune on their next phone and are looking for a good-looking handset, but we just expect better results everywhere to keep it in the same pedestal as some of the other prized options out there.
Software version of the review unit:
Android Version: 5.1
HTC Sense Version: 7.0
Build Number: 1.10.502.1
Kernel Version: 3.10.49-perf-g61b738f
Follow us on Google News


Things that are NOT allowed:
To help keep our community safe and free from spam, we apply temporary limits to newly created accounts: