Every product we review or recommend is thoroughly tested by our in-house experts in real-world conditions, following our
review methodology
and
ethics statement
to ensure honest, independent, and data-driven results.
Introduction
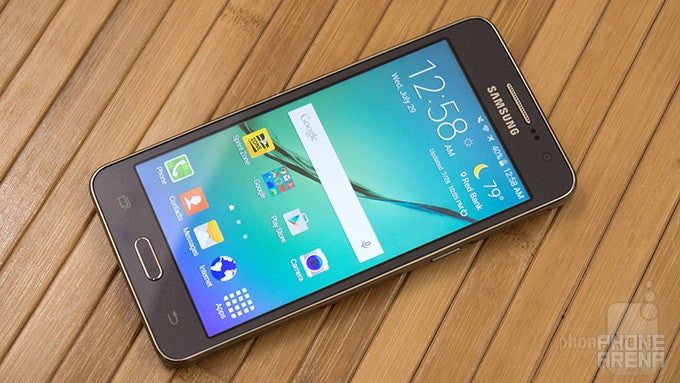
History has shown us that Samsung is notorious for giving some of its phones ridiculously long model names. Anyone remember the Samsung Galaxy S II Epic 4G Touch? As much as we’d like the practice to stop altogether, it’s still something that’s well and alive today – like the Samsung Galaxy Grand Prime most recently, for example. With words like grand and prime, you’d envision something super spec’d, but alas, that’s not the case here, as it’s just an entry-level offering that aims to diversify Sammy’s portfolio to cover all segments of the smartphone space.
The package contains:
Samsung Galaxy Grand Prime
microUSB cable
Wall charger
Stereo headphones
Get start guide
Important information
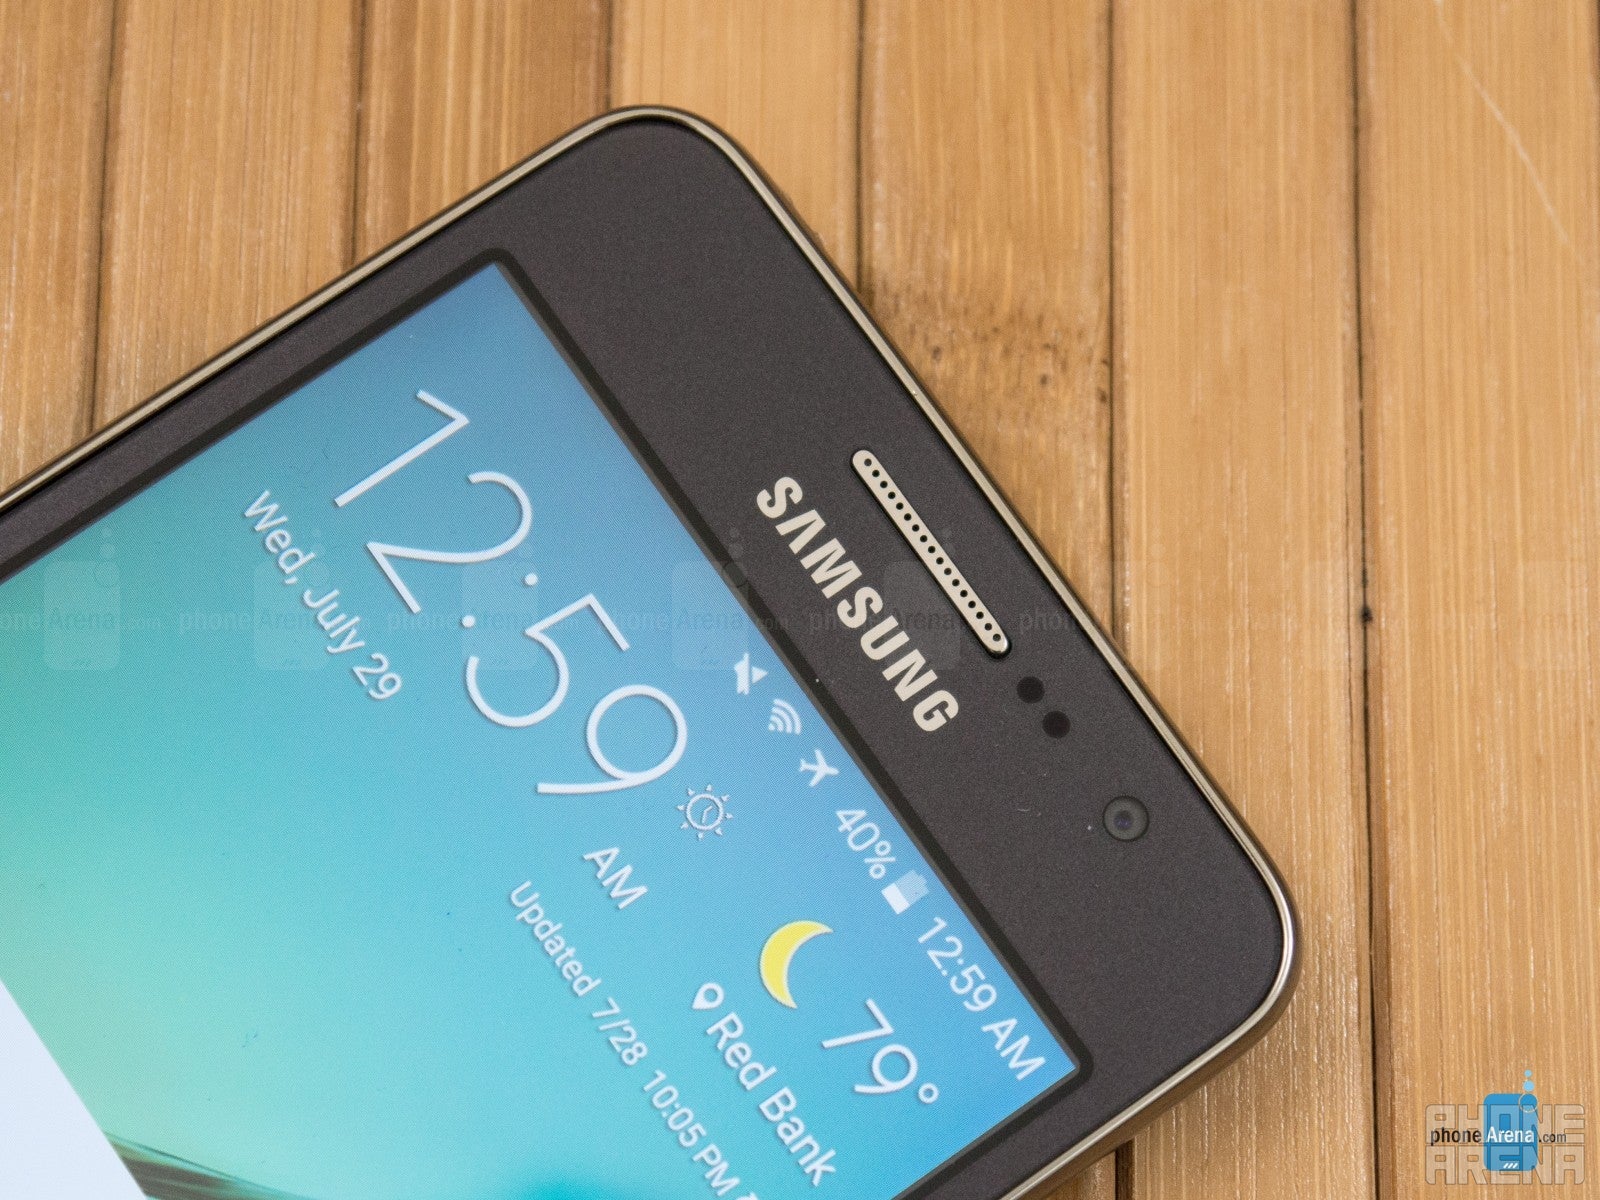
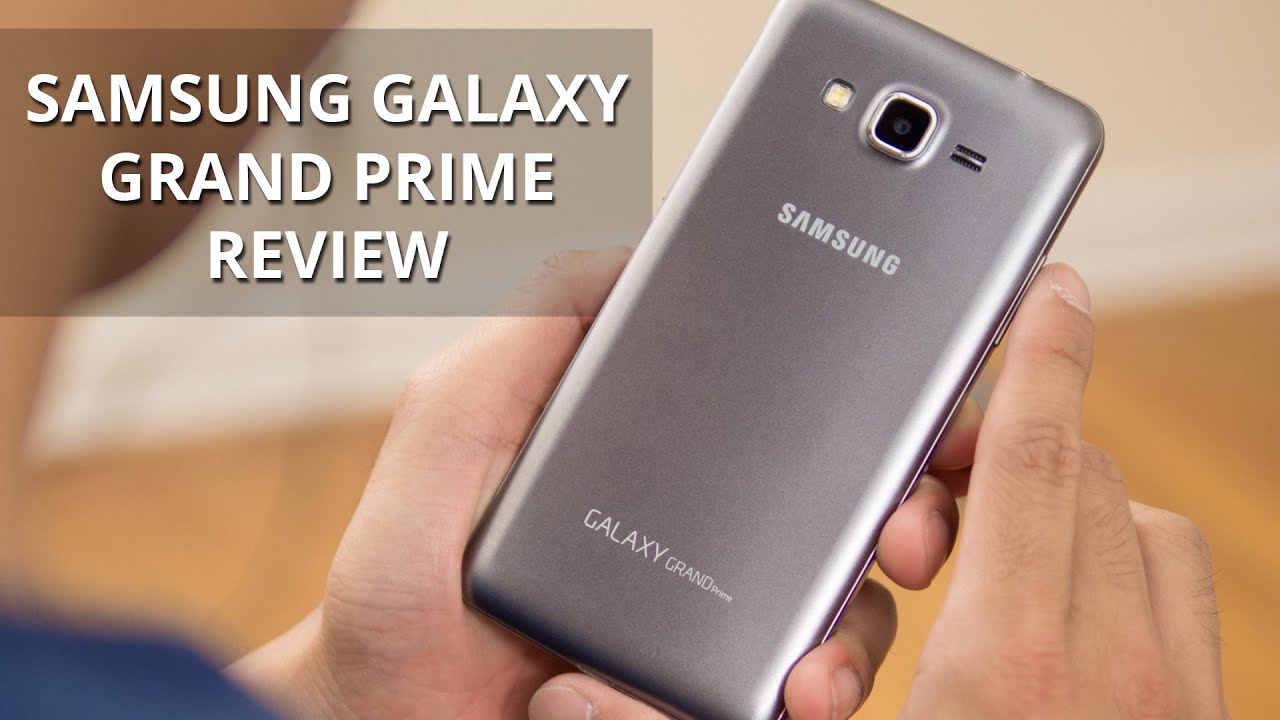
Design
Undeniably a Samsung design, it’s bland and dull looking for the most part, but it’s befitting for a low-end thing.
Distinctively employing the traits akin to its Galaxy line, the phone doesn’t scream anything remarkable with its straightforward and dull design. Constructed out of plastic, it naturally asserts itself as a budget-friendly offering – one that luckily doesn’t feel too cheap in the hand. In all fairness, the design is as bland and predictable as it goes for Samsung, which shouldn’t be too much of a surprise considering low-end stuff like this don’t normally get the royal treatment.
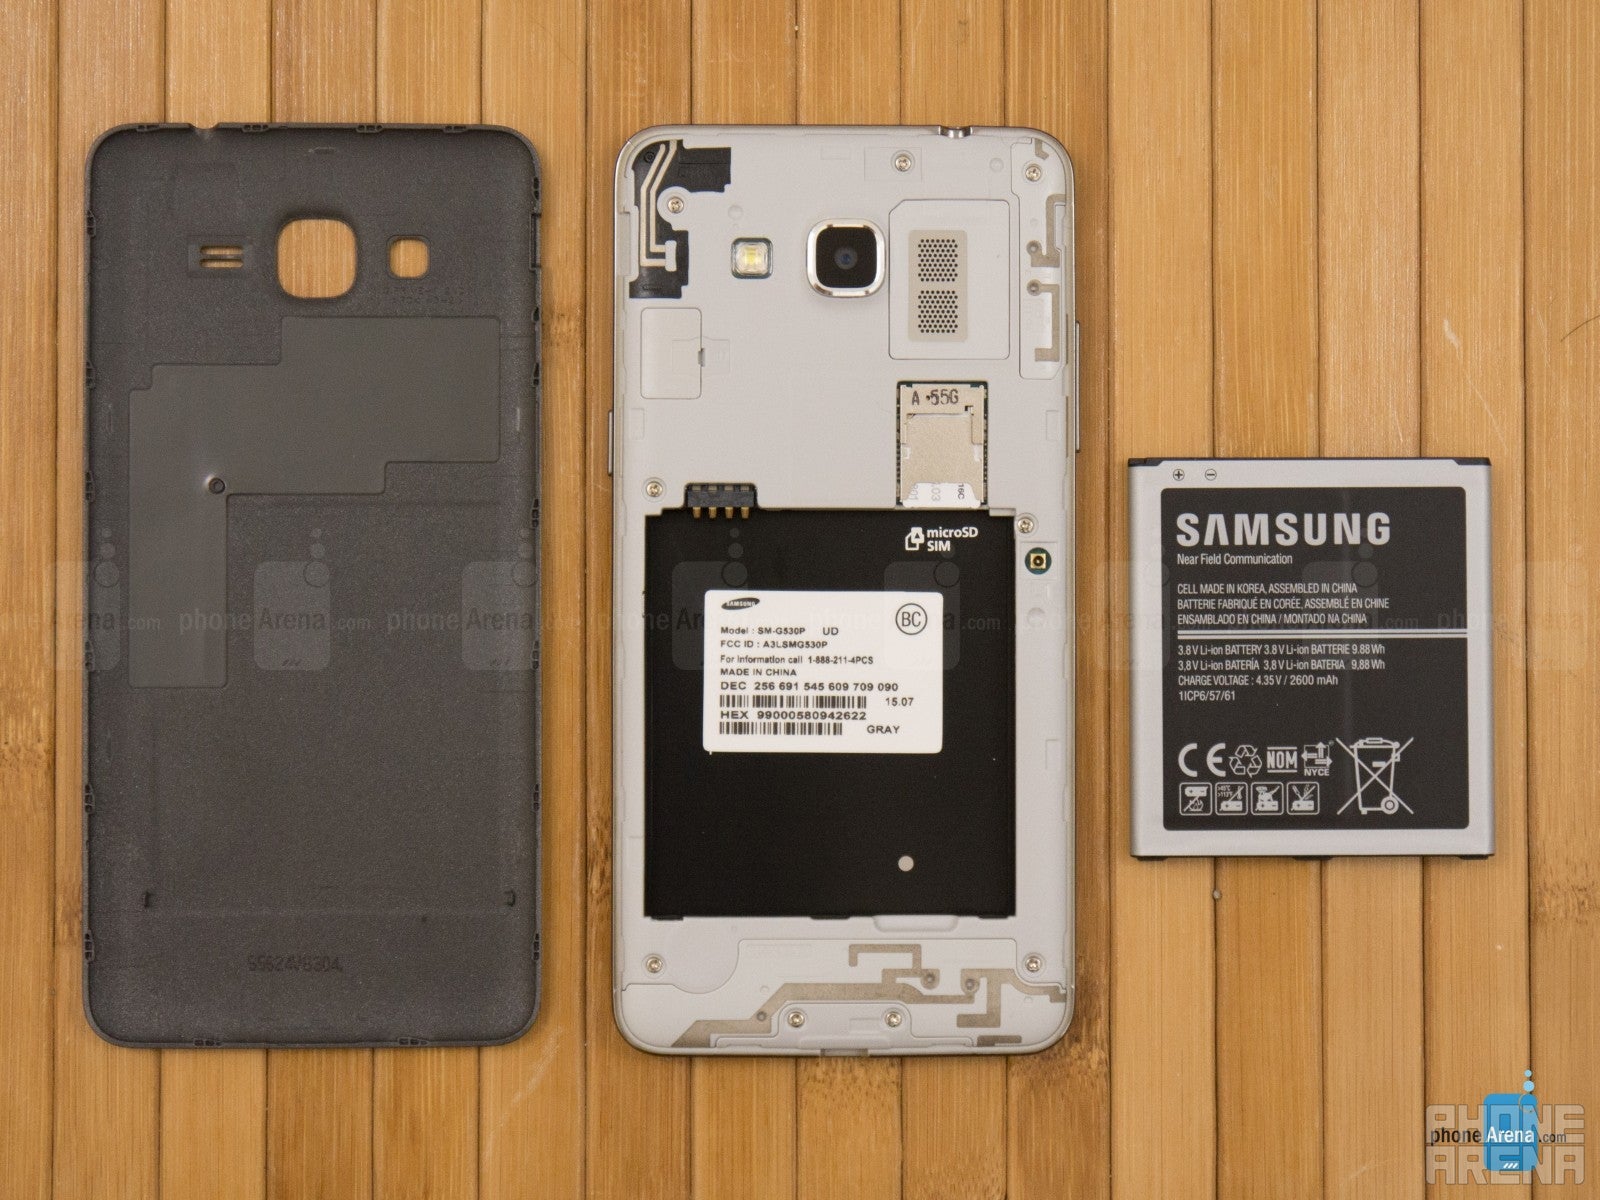
In true fashion to being a Galaxy branded phone, it features the same buttons and ports you’d find in other phones from Sammy – so that includes the power button along the left edge, volume controls on the right, 3.5mm headset jack on the top, and a microUSB port on the bottom. Yes, it even has the line’s distinguishable physical home button, flanked by capacitive buttons for back and recent apps. With this, however, the rear plastic cover can be removed to gain access to its battery, SIM, and microSD slots.
Don’t expect much out of the display, it matches the phone’s bland and boring attachment.
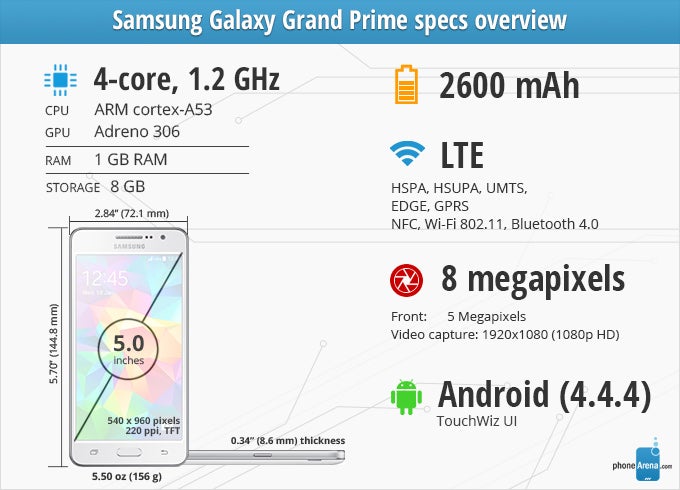
Traditionally, Samsung favors using AMOLED screens in its high-end devices, but for this lowly Galaxy Grand Prime, it’s treated to a 5-inch 540 x 960 (qHD) TFT display. While it’s still effective for making things out from a normal viewing distance, it’s something that requires closer inspection because of its softer visuals, which can be traced back to its pixel density count of 220 ppi.
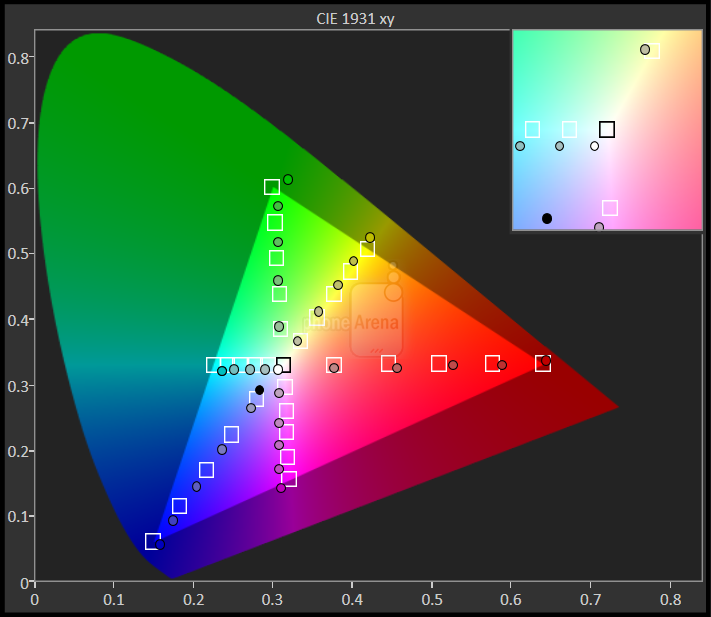
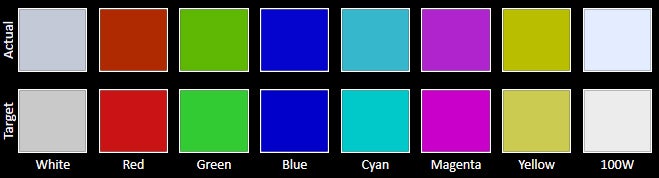
Going beyond the details, there aren’t a whole lot of characteristics to shed its reputation of being bland and boring as well. For one, its color temperature of ~7600K gives the screen a distinctively colder attachment – giving the color white a bluish hue. On top of that, we have a maximum luminance of 417 nits, visible distortion at wide viewing angles, and a color reproduction that favors a bluish undertone to varying degrees with the color magenta.
The numbers below represent the amount of deviation in the respective property,observed when a display is viewed from a 45-degree angle as opposed to direct viewing.
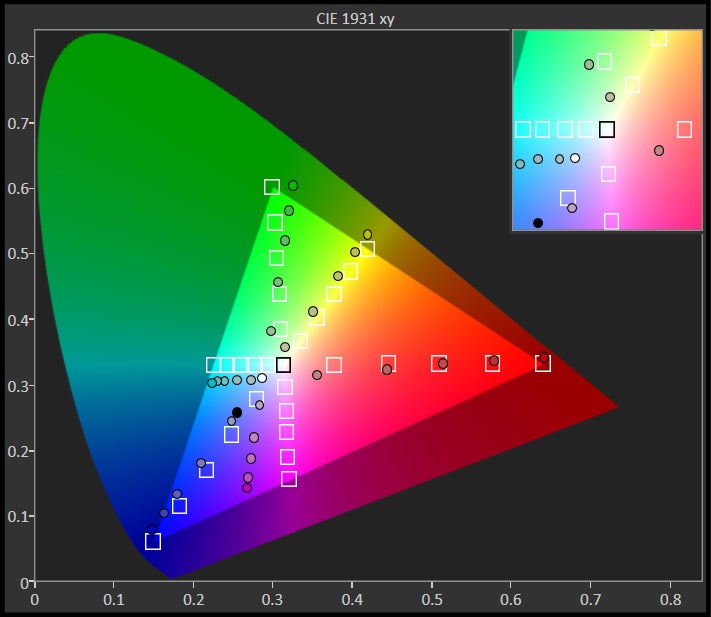
The CIE 1931 xy color gamut chart represents the set(area)of colors that a display can reproduce,with the sRGB colorspace(the highlighted triangle)serving as reference.The chart also provides a visual representation of a display's color accuracy. The small squares across the boundaries of the triangle are the reference points for the various colors, while the small dots are the actual measurements. Ideally, each dot should be positioned on top of its respective square. The 'x:CIE31' and 'y:CIE31' values in the table below the chart indicate the position of each measurement on the chart. 'Y' shows the luminance (in nits) of each measured color, while 'Target Y' is the desired luminance level for that color. Finally, 'ΔE 2000' is the Delta E value of the measured color. Delta E values of below 2 are ideal.
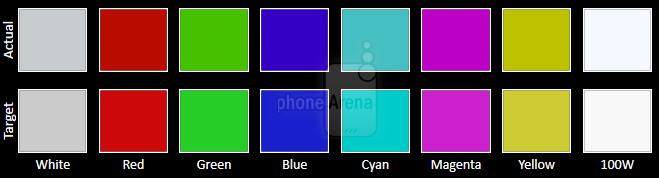
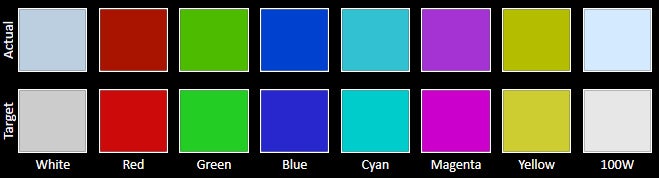
The Color accuracy chart gives an idea of how close a display's measured colors are to their referential values. The first line holds the measured (actual) colors, while the second line holds the reference (target) colors. The closer the actual colors are to the target ones, the better.
The Grayscale accuracy chart shows whether a display has a correct white balance(balance between red,green and blue)across different levels of grey(from dark to bright).The closer the Actual colors are to the Target ones,the better.
While it’s running the latest TouchWiz UI experience, it doesn’t have the stuff to please power users.
Hardly a surprise as well, the Samsung Galaxy Grand Prime is running the company’s TouchWiz UI experience. While it’s visually the same as the one featured in Samsung’s high-end phones, it’s a scaled down version when it comes to its features set – so you won’t find classic staples like Multi-Window here for true multi-tasking.
Needless to say, it suffices enough for basic things like any other Android smartphone. However, for power users, they’ll find the experience rather limiting. At least it's running on top of Android 5.1.1, which is contemporary enough.
Processor and Memory
Eh, it’s acceptable for the easy stuff, but don’t bother trying to do intensive tasks.
Samsung might be keeping things in-house when it comes to the chipset in its high-end portfolio, but for this lowly Galaxy Grand Prime, it’s fashioned with a quad-core 1.2 GHz Qualcomm Snapdragon 410 chip based on 64-bit architecture. Accompanied also with 1GB of RAM and the Adreno 306 GPU, the hardware set is equipped enough to handle the easy stuff, but do expect some instances of longer load times or pauses. It’s not terrible if you’re patient, but if you’re the kind of person that expects instant action, it can prove to be a significant compromise – so stay clear from gaming with this!
Sporting a miniscule 8GB of internal storage, there’s very little room available out of the box for you to splurge over. Therefore, it’s essential to supplement it by using its microSD card slot.
Page loads aren’t too much of an issue here, since it’s graced with 4G LTE connectivity, but we wouldn’t say that it’s the most ideal thing for surfing the web. Why’s that? Well, the screen lacks the sharpness to emphasize details, navigation can sometimes be choppy, and page rendering is rather slow.
Our particular review unit is Sprint compatible, which makes it compatible to run off the carrier’s CDMA network, but there are other variants that are available to play nicely with networks from T-Mobile and Cricket. For an entry-level thing, it comes with the usual set of connectivity features – so that consists of aGPS with Glonass, Bluetooth 4.0, 802.11 b/g/n Wi-Fi, and even NFC.
Camera
An entry-level phone with elementary results from its camera.
We’re spoiled, that’s just the honest truth. Being jaded by all of these high-end phones, we shouldn’t be too concerned that the Samsung Galaxy Grand Prime is armed with an 8-megapixel rear camera – while the front-facing one chimes in at 5-megapixels.
Despite its unappealing camera specs sheet, it’s nice to see that Sammy doesn’t refrain from giving it the same camera experience as its highly-esteemed siblings. There’s a lot of fun available with this, since it blends Samsung’s diversified shooting modes with a useful manual mode as well – albeit, the shutter speed is controlled by the camera.
Continuing with the theme of bland and boring, its camera doesn’t generate anything mind-blowing to get us away from the juggernauts in the space. Sure, some might be fooled into thinking it takes exceptional photos, but our eyes tell us that there’s nothing memorable whatsoever produced by it. While it’s decent for ideal shooting conditions (think plenty of lighting), it’s a total wash when it comes to low light, due to its muddy details, inconsistent color reproduction, and heavy noise.
Likewise, it’s not a strong performer either with its 1080p video recording quality. There’s just simply a lack of intensity with details and colors to make its quality within reasonable acceptance.
Multimedia
Ouch, its rear firing speaker is severely underpowered.
On board is Samsung’s Milk Music player, which is its streaming music service. Not your cup of tea? Well, there’s always Google Play Music as an alternative. Regardless of your preference, the single rear-firing speaker sounds rather timid and weak at 71.4 dB of power.
Even though it’s more than capable of playing back all sorts of high-definition video content with no hitches to its playback, the dullness of the screen in conjunction with its weak viewing angles doesn’t make it a stronger candidate for the occasion. It suffices, obviously, but don’t expect a world-class experience here.
You know it’s not great when we’re having to repeat ourselves constantly.
In listening to voices through the earpiece, they sound mostly clear and free of noise, but on the other end of the line, our callers struggle to decipher our conversation. That’s because of the subdued and pitchy voices they’re exposed to on their end. Well, things don’t get any better with the speakerphone either, mainly because voices sound underpowered through it.
Battery
The battery performance is average, but it’s obnoxiously long to charge.
It goes to show that not all phones are optimized equally! Tucking away a removable 2600 mAh battery, one would surmise it would be more long-lasting than the Galaxy S6 and its smaller capacity 2550 mAh cell, but that’s hardly the case. Yes, it’s more than sufficient in getting us close through one-day of normal usage, but our battery benchmark tests reveals that it achieves an average mark of 6.5 hours.
Well, at least there’s rapid charging, right? Nope! Instead, it takes this phone an excruciating 175 minutes to refill itself back to 100% capacity.
The common stigma with entry-level phones is that they never seem to get any love. To a certain degree, that continues to be the case, but as we’ve seen this year, several low to mid-end smartphones have proven themselves to be attractive options thanks to their strong performances. Unfortunately for the Samsung Galaxy Grand Prime, it’s not one of those that we can include – it’s just a forgettable phone with a forgettable experience.
Frankly, even with its on and off contract prices of $30 and $240, respectively, it’s hard to recommend picking this up knowing there are several other phones similarly priced that generate better performances and results – not to mention better looking too! On the Android side, you’ll want to look into phones like the Asus Zenfone 2, which is significantly superior in many departments over this. And over on the Windows Phone side, it might be a good idea to check out the Microsoft Lumia 640, which undercuts this with its MSRP of $130.
A discussion is a place, where people can voice their opinion, no matter if it
is positive, neutral or negative. However, when posting, one must stay true to the topic, and not just share some
random thoughts, which are not directly related to the matter.
Things that are NOT allowed:
Off-topic talk - you must stick to the subject of discussion
Offensive, hate speech - if you want to say something, say it politely
Spam/Advertisements - these posts are deleted
Multiple accounts - one person can have only one account
Impersonations and offensive nicknames - these accounts get banned
To help keep our community safe and free from spam, we apply temporary limits to newly created accounts:
New accounts created within the last 24 hours may experience restrictions on how frequently they can
post or comment.
These limits are in place as a precaution and will automatically lift.
Moderation is done by humans. We try to be as objective as possible and moderate with zero bias. If you think a
post should be moderated - please, report it.
Have a question about the rules or why you have been moderated/limited/banned? Please,
contact us.


Things that are NOT allowed:
To help keep our community safe and free from spam, we apply temporary limits to newly created accounts: